Significance
Importance To Berry Global and our Stakeholders
The management of our energy usage and subsequent emissions is vital to meet our commitments to sustainability, operational efficiency, and environmental stewardship. By adopting efficient energy practices and reducing emissions, we not only lower operational costs, but also reduce the carbon footprint of our business and aid the transition to net-zero. By embracing renewable energy sources and optimizing energy consumption, we foster operational resilience to climate risk and facilitate responsible growth opportunities.
Our Customers: Many of our customers have committed to net-zero. This requires they eliminate both their operational emissions and value chain emissions. As a critical part of our customers’ value chains, they have made it clear that they want us to support their emissions reductions goals by reducing our own operational emissions as well as offering them lower-carbon products.
Our Investors: Climate change presents many risks and opportunities. By demonstrating an effective energy and emissions management strategy, we reflect our dedication to responsible business practices and assure that we are not only aligned with global sustainability goals but also actively managing potential risks and opportunities.
Our Approach
Berry is committed to helping address climate change by advancing decarbonization in our products, operations, and value chain. We act on this through strong climate governance, a robust risk management methodology, and strategic planning. Our climate strategy centers on Berry’s commitment to achieving net-zero emissions across our global operations and value chain by 2050. As part of this, we have set science-based targets to reduce our total Scope 1, 2, and 3 emissions over 90% and neutralize our remaining residual GHG emissions by 2050. Meeting these goals helps ensure Berry is aligned with a 1.5°C warming scenario and supports the Paris Agreement’s goal of limiting global warming to well-below 2°C. To achieve net-zero, Berry is working to develop more circular plastics, engaging partners in our value chain to develop low-carbon solutions, and investing in renewable energy. We also had a near-term goal of reducing our emissions by 25% by 2025, approved by the Science Based Targets initiative (SBTi). Berry achieved our Scopes 1 and 2 emissions reductions early and we remain on track to achieve our Scope 3 target in 2025. We implement an annual climate change risk management process, including the Berry Global Enterprise Risk Assessment (ERA), a carbon risk assessment in line with the Task Force on Climate-Related Financial Disclosures (TCFD) guidelines. We also collaborate with our suppliers and customers to commercialize products made with low-carbon raw materials to reduce our value chain emissions. Other activities for lowering the carbon intensity of our operations include reducing our use of fossil-based energy and increasing circular plastics in accordance with the International Energy Agency (IEA) Net Zero Emissions (NZE) by 2050 Scenario.
We use an operational control approach as our reporting boundary, in line with the GHG Reporting Protocol and with guidance from the GHG Protocol’s Corporate Value Chain (Scope 3) Reporting and Accounting Standard. To increase the ease of reporting and quality of the information reported, we exclude several minor emissions sources, including minor quantities of liquefied petroleum gas (LPG), Heavy Fuel Oil (HFO), kerosene, gasoline, and diesel at U.S. facilities, and energy use in offices and non-production facilities.
Additionally, we do not report emissions of Sulfur Oxides (SOx), Nitrogen Oxides (NOx), and Volatile Organic Compounds (VOCs) from the use of refrigerants and welding gases. These are only tracked at the site level, and they have repeatedly been confirmed to be a de minimis contributor to our overall emissions. During screening, six Scope 3 categories were considered not applicable to our reporting and have also been excluded: Use of Sold Products, Processing of Sold Products, Upstream Leased Assets, Downstream Leased Assets, Franchises, and Investments. We estimate the total exclusions from our reporting amount to less than 5% of our potential total operational and value-chain emissions footprint.
We report our emissions data in carbon dioxide equivalents (CO₂e), a metric that allows us to measure emissions from all GHG emissions as one number by converting the amounts of other greenhouse gases to the equivalent amount of carbon dioxide. The Global Warming Potential (GWP) used in calculations of CO₂e is taken from the Intergovernmental Panel on Climate Change (IPCC) Fifth Assessment Report (AR5). When calculating our market-based GHG emissions, carbon offsets are not included as offsets are not used to measure progress towards targets. Historical data may be recalculated to align with updated methodology.
Highlights and Target Progress
| Priority | 2024 Update |
| Reduce Scope 1 & 2 absolute emissions 25% by 2025 from a 2019 baseline | We have reduced our Scope 1 and 2 absolute emissions by 28.3%, continuing to surpass our 2025 target of 25% reduction in Scope 1 and 2 emissions versus 2019 one year early |
| Reduce Scope 3 absolute emissions 25% by 2025 from a 2019 baseline | We have achieved a 22% reduction in Scope 3 emissions since 2019, and are on track for achieving a 25% reduction by 2025. |
| Net-zero greenhouse gas emissions by 2050 | We have reduced our total emissions 23% since 2019 |
| Increase renewable energy use year on year | We increased the amount of renewable energy used annually by 30%. |
| Reduce Energy Consumption Intensity 1% per year | Energy intensity increased by 0.4%. However, Berry implemented CapEx initiatives to eliminate over 40,000 Mwh of energy usage annually. We continue to work to implement further initiatives to improve energy efficiency |
Key Metrics
|
Energy |
|||||||||||||||||||
| 2022 | 2023 | 2024 | |||||||||||||||||
| Absolute Energy Consumption | Amount and Percentage of Energy Consumption | ||||||||||||||||||
| MWh | Percentage | MWh | Percentage | MWh | Percentage | ||||||||||||||
| Electricity | Renewable | 184,548 | 3% | 306,696 | 6% | 400,459 | 7% | ||||||||||||
| Non-Renewable | 4,723,544 | 79% | 4,2349,920 | 76% | 4,086,343 | 74% | |||||||||||||
| Total | 4,908,091 | 83% | 4,556,616 | 82% | 4,486,802 | 82% | |||||||||||||
| Natural Gas | 667,416 | 11% | 700,857 | 13% | 720,387 | 13% | |||||||||||||
| Steam | 257,483 | 4% | 199,163 | 4% | 186,762 | 3% | |||||||||||||
| Other Energy Sources 1 | 111,468 | 2% | 109,569 | 2% | 106,880 | 2% | |||||||||||||
| Total Energy | Renewable | 184,548 | 3% | 306,696 | 6% | 400,459 | 7% | ||||||||||||
| Non-Renewable | 5,759,910 | 97% | 5,259,523 | 94% | 5,100,402 | 93% | |||||||||||||
| Total | 5,944,457 | 100% | 5,566,219 | 100% | 5,500,861 | 100% | |||||||||||||
| Amount and Percentage of Energy Consumption by Division | |||||||||||||||||||
| MWh | Percentage | MWh | Percentage | MWh | Percentage | ||||||||||||||
| Consumer Packaging International (CPI) Division | 1,556,875 | 26% | 1,462,143 | 26% | 1,466,260 | 27% | |||||||||||||
| Consumer Packaging North America (CPNA) Division | 1,387,316 | 23% | 1,335,899 | 24% | 1,298,924 | 24% | |||||||||||||
| Flexibles (FLEX) Division | 1,163,385 | 20% | 1,075,877 | 19% | 1,056,034 | 19% | |||||||||||||
| Health, Hygiene & Specialties (HHS) Division | 1,794,100 | 30% | 1,645,625 | 30% | 1,638,283 | 30% | |||||||||||||
| Transport Fleet | 42,781 | 1% | 46,676 | 1% | 41,359 | 1% | |||||||||||||
| Percentage | |||||||||||||||||||
| Percentage of Reported Electricity supplied via Electricity Grid | >99% | >99% | >99% | ||||||||||||||||
| Energy consumption per MT of Production (MWh/MT) | |||||||||||||||||||
| Electricity | 1.255 | 1.277 | 1.277 | ||||||||||||||||
| Natural Gas | 0.071 | 0.196 | 0.205 | ||||||||||||||||
| Steam | 0.066 | 0.056 | 0.053 | ||||||||||||||||
| Other Energy Sources 1 | 0.028 | 0.031 | 0.03 | ||||||||||||||||
| Total Energy | 1.52 | 1.559 | 1.565 | ||||||||||||||||
| Energy Intensity by Division (MWh/MT) | |||||||||||||||||||
| Consumer Packaging International (CPI) Division | 2.081 | 2.168 | 2.196 | ||||||||||||||||
| Consumer Packaging North America (CPNA) Division | 1.507 | 1.514 | 1.486 | ||||||||||||||||
| Flexibles Division | 0.876 | 0.913 | 0.922 | ||||||||||||||||
| Health, Hygiene & Specialties (HHS) Division | 1.962 | 1.973 | 1.979 | ||||||||||||||||
| Renewable Energy | MWh | ||||||||||||||||||
| Renewable Energy Consumption | 184,548 | 306,696 | 400,459 | ||||||||||||||||
| Percentage | |||||||||||||||||||
| Renewable Energy as a percentage of Total Electricity Consumption | 3.80% | 6.70% | 8.90% | ||||||||||||||||
| Renewable Energy as a percentage of Total Energy Consumption | 3.10% | 5.50% | 7.30% | ||||||||||||||||
| Amount and Percentage of Renewable Energy Procurement, by Division | |||||||||||||||||||
| MWh | Percentage | MWh | Percentage | MWh | Percentage | ||||||||||||||
| Consumer Packaging International (CPI) Division | 61,991 | 34% | 110,068 | 36% | 126,934 | 32% | |||||||||||||
| Consumer Packaging North America (CPNA) Division | 676 | 0% | 2927 | 1% | 4,051 | 1% | |||||||||||||
| Flexibles (FLEX) Division | 25,548 | 14% | 28,203 | 9% | 28,966 | 7% | |||||||||||||
| Health, Hygiene & Specialties (HHS) Division | 89,332 | 48% | 165,498 | 54% | 145,059 | 36% | |||||||||||||
| Corporate 2 | 7,000 | 4% | 0 | 0% | 95,000 | 24% | |||||||||||||
| Energy Reduction Programs | Energy Requirement reductions due to CapEx Initiatives (MWh) 3 | ||||||||||||||||||
| Consumer Packaging International (CPI) Division | 33,775 | 42,265 | 15,299 | ||||||||||||||||
| Consumer Packaging North America (CPNA) Division | 20,106 | 2,250 | 2,177 | ||||||||||||||||
| Flexibles (FLEX) Division | 11,809 | 2,756 | 15,586 | ||||||||||||||||
| Health, Hygiene & Specialties (HHS) Division | 9,981 | 5,258 | 6,980 | ||||||||||||||||
| Berry Global Total | 75,671 | 52,529 | 40,042 | ||||||||||||||||
|
Greenhouse Gas Emissions |
|||||||||||||||||||
| Absolute Operational Emissions | 2019 Baseline | 2022 | 2023 | 2024 | |||||||||||||||
| Amount and Percentage of Emissions | |||||||||||||||||||
| MT CO₂e | MT CO₂e | MT CO₂e | MT CO₂e | Percentage | |||||||||||||||
| Scope 14 | 143,927 | 141,821 | 145,839 | 147,662 | 9% | ||||||||||||||
| Scope 2 (Market-Based) 5 | 2,106,565 | 1,659,224 | 1,567,296 | 1,612,979 | 91% | ||||||||||||||
| Total Market-Based Emissions | 2,250,492 | 1,801,045 | 1,713,135 | 1,612,979 | 100% | ||||||||||||||
| Scope 2 (Location Based)5 | 2,122,646 | 1,706,321 | 1,655,577 | 1,611,077 | 92% | ||||||||||||||
| Total Location-Based Emissions | 2,266,573 | 1,848,142 | 1,801,416 | 1,758,739 | 100% | ||||||||||||||
| Amount and Percentage of Emissions by Division (Market-Based) | |||||||||||||||||||
| MT CO₂e | MT CO₂e | MT CO₂e | MT CO₂e | Percentage | |||||||||||||||
| Consumer Packaging International (CPI) Division | Scope 1 | 12,112 | 15,776 | 19,097 | 24,133 | 16% | |||||||||||||
| Scope 2 (Market-Based) | 558,415 | 444,107 | 407,181 | 402,006 | 27% | ||||||||||||||
| Total Market-Based Emissions | 570,527 | 459,883 | 426,278 | 426,139 | 26% | ||||||||||||||
| Scope 2 (Location-Based) | 563,486 | 461,271 | 436,781 | 435,719 | 27% | ||||||||||||||
| Total Location-Based Emissions | 575,598 | 477,046 | 455,879 | 459,852 | 26% | ||||||||||||||
| Consumer Packaging North America (CPNA) Division | Scope 1 | 12,328 | 11,844 | 11,328 | 10,268 | 7% | |||||||||||||
| Scope 2 (Market-Based) | 658,208 | 519,181 | 528,532 | 497,575 | 34% | ||||||||||||||
| Total Market-Based Emissions | 670,536 | 531,025 | 539,860 | 507,843 | 31% | ||||||||||||||
| Scope 2 (Location-Based) | 658,208 | 519,373 | 529,659 | 499,310 | 31% | ||||||||||||||
| Total Location-Based Emissions | 670,536 | 531,217 | 540,986 | 509,578 | 29% | ||||||||||||||
| Flexibles (FLEX) Division | Scope 1 | 42,217 | 44,866 | 42,528 | 40,941 | 28% | |||||||||||||
| Scope 2 (Market-Based) | 421,988 | 306,042 | 294,885 | 285,449 | 19% | ||||||||||||||
| Total Market-Based Emissions | 464,205 | 350,908 | 337,414 | 326,390 | 20% | ||||||||||||||
| Scope 2 (Location-Based) | 432,998 | 314,706 | 305,137 | 295,558 | 18% | ||||||||||||||
| Total Location-Based Emissions | 475,214 | 359,572 | 347,665 | 336,498 | 19% | ||||||||||||||
| Health, Hygiene & Specialties (HHS) Division | Scope 1 | 63,000 | 58,486 | 61,054 | 61,840 | 42% | |||||||||||||
| Scope 2 (Market-Based) | 467,955 | 394,218 | 336,697 | 338,493 | 23% | ||||||||||||||
| Total Market-Based Emissions | 530,955 | 452,704 | 397,751 | 400,333 | 25% | ||||||||||||||
| Scope 2 (Location-Based) | 467,955 | 410,972 | 384,000 | 380,490 | 24% | ||||||||||||||
| Total Location-Based Emissions | 530,955 | 469,458 | 445,053 | 442,330 | 25% | ||||||||||||||
| Transport Fleet | Scope 1 | 14,269 | 10,849 | 11,832 | 10,480 | 7% | |||||||||||||
| Corporate reductions 6 | Scope 2 (Market-Based) | 0 | -4,323 | 0 | -58,207 | -4% | |||||||||||||
| 2024 | |||||||||||||||||||
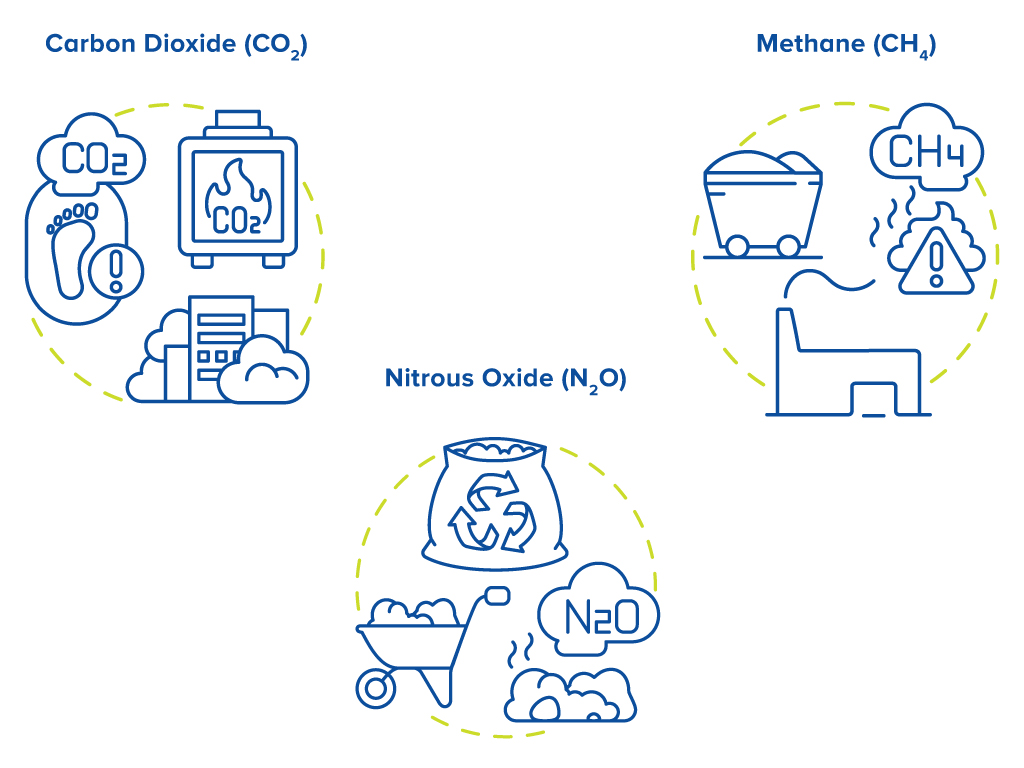
| 2023 Greenhouse Gas types 7 | Amount, by Greenhouse Gas type | ||||||||||||||||||
| MT CO₂ | MT CH₄ | MT N₂O | |||||||||||||||||
| Scope 1 | 147,528 | 2,458 | 246 | ||||||||||||||||
| Scope 2 (Market-Based) | 1,457,289 | 759 | 2,301 | ||||||||||||||||
| Total Market-Based Emissions | 1,604,817 | 3,217 | 2,457 | ||||||||||||||||
| Scope 2 (Location-Based) | 1,602,372 | 929 | 2,793 | ||||||||||||||||
| Total Location-Based Emissions | 1,749,900 | 3,387 | 3,055 | ||||||||||||||||
| 2019 Baseline |
2022 | 2023 | 2024 | ||||||||||||||||
| Operational Emissions Intensity | Emissions produced per MT of Production (MT CO₂e/MT) | ||||||||||||||||||
| Scope 1 | 0.037 | 0.036 | 0.041 | 0.042 | |||||||||||||||
| Scope 2 (Market-Based) | 0.54 | 0.424 | 0.439 | 0.417 | |||||||||||||||
| Total Market-Based Emissions | 0.577 | 0.461 | 0.48 | 0.459 | |||||||||||||||
| Scope 2 (Location-Based) | 0.544 | 0.436 | 0.464 | 0.458 | |||||||||||||||
| Total Location-Based Emissions | 0.581 | 0.473 | 0.50 | 0.5 | |||||||||||||||
| Market-Based Emissions produced per MT of Production by Division (MT CO₂e/MT) | |||||||||||||||||||
| Consumer Packaging International (CPI) Division | 0.717 | 0.615 | 0.632 | 0.638 | |||||||||||||||
| Consumer Packaging North America (CPNA) Division | 0.793 | 0.577 | 0.612 | 0.581 | |||||||||||||||
| Flexibles (FLEX) Division | 0.328 | 0.264 | 0.286 | 0.285 | |||||||||||||||
| Health, Hygiene & Specialties (HHS) Division | 0.628 | 0.495 | 0.477 | 0.484 | |||||||||||||||
| Transport Fleet | n/a | n/a | n/a | n/a | |||||||||||||||
| Berry Global Total | 0.577 | 0.461 | 0.48 | 0.459 | |||||||||||||||
| 2019 Baseline |
2022 | 2023 | 2024 | ||||||||||||||||
| Absolute Value Chain Emissions | Amount and Percentage of Value Chain Emissions | ||||||||||||||||||
| MT CO₂e | MT CO₂e | MT CO₂e | MT CO₂e | Percentage | |||||||||||||||
| Total Scope 3 Emissions 8 |
11,019,575 | 9,879,620 | 8,628,530 | 8,602,616 | 100% | ||||||||||||||
| Purchased Goods and Services | 7,539,027 | 6,333,350 | 5,586,825 | 5,593,642 | 65% | ||||||||||||||
| Fuel & Energy | 445,786 | 442,180 | 352,866 | 348,208 | 4% | ||||||||||||||
| Capital Goods | 70,783 | 69,299 | 66,753 | 51,883 | 1% | ||||||||||||||
| Waste in Operations | 31,189 | 27,873 | 28,512 | 31,031 | 0% | ||||||||||||||
| Business Travel | 20,992 | 11,980 | 12,360 | 17,345 | 0% | ||||||||||||||
| Employee Commuting | 225,109 | 208,467 | 182,272 | 175,701 | 2% | ||||||||||||||
| Downstream T&D | 243,231 | 177,495 | 177,567 | 192,429 | 2% | ||||||||||||||
| Upstream T&D | 466,643 | 478,091 | 386,052 | 404,147 | 5% | ||||||||||||||
| End of Life of Sold Products | 1,976,816 | 2,130,884 | 1,835,324 | 1,788,230 | 21% | ||||||||||||||
2 Renewable Energy Certificates (RECs) are sometimes purchased at a corporate level to complement division-led renewable projects.
3 Reported numbers represent calculated annual savings from energy reduction and efficiency CapEx Projects implemented during the reported year, and does not represent the total changes in energy requirements for that year. Data does not include savings achieved through non-CapEx projects.
4 Scope 1 emissions are emissions from sources that our organization owns or controls directly – for example, combustion of fuel.
5 Scope 2 emissions are emissions from purchased energy - such as electricity and steam. Location-based emissions are calculated based on the average emission factor to produce electricity in the region where that electricity is used. Market-based emissions are calculated using our specific contracts, where available, including specific Renewable Energy Certificate (REC) purchases.
6 Renewable Energy Certificates (RECs) are proactively purchased at corporate level outside of the divisional structure and then assigned to relevant facilities, reducing their emissions.
7 Internal investigations have determined NOx (Nitrous Oxides), SOx (Sulfur Oxides), and VOC emissions are insignificant and therefore we do not report a company-wide number. Emissions from these sources are tracked at site level and, if applicable, are documented and reported in-line with site air operating permits.
8 Scope 3 emissions are indirect emissions resulting from upstream and downstream activities within our value chain.
Key Strategies
Climate Governance
Board-Level Oversight
Creating positive environmental change is fundamental to Berry Global's culture and permeates all organizational levels. Our Board of Directors integrates sustainability into our core strategy and risk management framework.
The Board holds ultimate responsibility for our environmental strategy, including climate initiatives. It oversees climate-related risk management, ensures adherence to the highest governance standards, and annually reviews our sustainability plans and potential future challenges.
Executive Leadership
Our CEO bears overall accountability for:
- Risk management, including climate-related concerns
- Corporate sustainability goals achievement
- GHG emissions reduction targets
- Other climate-related metrics
Committee Structure
The Nominating and Governance Committee primarily oversees:
- ESG strategy development
- Initiative implementation
- Climate risk and opportunity disclosure
The Audit Committee supports the Board by:
- Reviewing major risk exposures
- Evaluating annual corporate-wide risk assessments
- Examining risk management policies, including those related to climate
Operational Management
Climate risks are continuously monitored through:
- The CEO and Board's direct oversight
- Annual Enterprise Risk Assessment (ERA) process
- Independent risk identification by the SVP of Sustainability
The SVP of Sustainability:
- Reports to the CEO
- Manages GHG targets, reporting, and compliance
- Conducts annual carbon and physical climate risk assessments
- Communicates assessment results to senior leadership

Kevin Kwilinski, Chief Executive Officer (CEO)
- Holds overall responsibility for corporate strategy governance, performance, internal controls, and risk management, with oversight by the Berry Global Board.
- Monitors climate-related issues identified by the Company’s annual Enterprise Risk Assessment process.

- Oversees all of Berry Global’s worldwide operations and reports directly to the CEO.
- Oversees and monitors climate-related issues, such as the company’s GHG emissions reduction strategy and supports the development and drives the execution of operational and climate goals.

- Reports directly to the CEO and is responsible for the annual ERA, a company-wide risk analysis that monitors, among other topics, climate-related issues, and associated risks.
Climate Strategy and Risk Management
Scenario Analysis
We employ multiple climate scenarios to understand potential business impacts and guide our strategy. These scenarios include both current policy benchmarks and pathways to achieve specific global warming targets.
Impact 2025 Development (2°C Pathway)
When crafting our original Impact 2025 Sustainability Strategy, we conducted comparative modeling using:
- Target Scenario: IEA ETP 2DS (2°C Scenario)
- Baseline: IEA 2016 STEPS (Stated Policies Scenario)
This analysis informed our initial GHG emissions intensity reduction targets aligned with limiting warming to 2°C. As a direct result, we:
- Established global reduction targets
- Allocated capital for energy reduction projects
- Prioritized renewable energy sourcing
- Created company-wide focus on energy management
Strategic Enhancement (1.5°C Pathway)
In 2021, we strengthened our commitment by expanding Impact 2025 based on the IEA NZE2050 (Net-Zero Emissions by 2050) pathway, compatible with limiting warming to 1.5°C by 2100.
This led to setting new SBTi-approved science-based targets:
- 25% reduction in Scope 1 & 2 emissions by 2025 (2019 baseline)
- 25% reduction in Scope 3 emissions by 2025 (2019 baseline)
Long-Term Commitment
In 2023, we formalized our pledge to achieve net-zero emissions by 2050. These GHG reduction targets form the cornerstone of our climate strategy, complemented by additional Impact 2025 initiatives that support our transition to a net-zero world.
IEA Stated Policies Scenario (STEPS)
The STEPS (Stated Policies) Scenario projects future outcomes based on currently enacted and announced government policies worldwide. This forward-looking assessment evolves as policy landscapes change, with the most recent update released in 2021.
Climate Trajectory
Under STEPS, global temperatures would exceed 1.5°C before 2030 and continue rising to reach 2.6°C by 2100. This warming trajectory would significantly increase the frequency and intensity of climate-related disasters, creating substantial climate risks to our business operations and industry as a whole.
Industry-Specific Impacts
For the plastics sector, STEPS projects global plastics recycling rates reaching only 20% by 2030. This persistent shortage of recycled feedstock alternatives would force continued dependence on virgin material-based product portfolios, limiting our ability to transition to more sustainable options.
Economic Consequences
The scenario forecasts increased petrochemical sector demand for oil, driving rising prices as new supply sources become necessary. Our industry would face continued reliance on crude oil as the primary plastic feedstock, creating significant price pressures throughout our supply chain. These market dynamics would constrain innovation and sustainability efforts.
Business Assessment
Remaining on a STEPS trajectory would be universally detrimental to our business sustainability and long-term viability. The combination of environmental impacts, resource constraints, and economic pressures makes this scenario particularly challenging for our operations and strategic objectives.
IEA ETP 2DS Scenario
The IEA ETP 2DS Scenario charts a potential pathway with at least a 50% chance of limiting global warming to 2°C by 2100. Unlike the more conservative STEPS scenario, 2DS demands a fundamental transformation of global energy production and consumption patterns.
Energy Transition Requirements
While energy demand continues to rise under 2DS, emissions from the energy sector must decline dramatically to one-quarter of 2017 levels by 2060. This transition would reduce fossil fuels to just 35% of primary energy demand, requiring substantial shifts toward renewable and low-carbon alternatives.
Chemical and Petrochemical Sector Challenges
For our industry to thrive in a 2DS world, we face a critical balancing act: annual direct CO₂ emissions increases must remain below 3.6% through 2025 even as product demand surges by 47%. This requires significant innovation in production methods and materials.
Decarbonization Pathways
Two essential approaches to sector decarbonization emerge under 2DS:
- Expanded pre- and post-consumer recycling offers more energy-efficient process pathways compared to conventional virgin resin production.
- Bio-based alternatives for downstream plastic products provide additional decarbonization opportunities.
Strategic Impact
Our analysis of this scenario in 2019 fundamentally shaped our Impact 2025 sustainability strategy, accelerating our business transition toward a lower-carbon future. These insights continue to guide our investment decisions, innovation priorities, and operational transformations.
IEA NZE Scenario
A Blueprint for Energy Transformation
The IEA Net Zero Emissions (NZE) scenario outlines a realistic pathway to achieve net-zero emissions by 2050. It provides a detailed timeline and requirements for the global energy transition, establishing clear milestones for decarbonization across all sectors.
Fossil Fuel Transformation
Under NZE, fossil fuel usage would decline dramatically. By 2050, remaining fossil fuels would primarily serve two purposes: as feedstock for carbon-embedded products like plastics, or in facilities equipped with Carbon Capture Utilization & Storage (CCUS) technology.
Chemical Industry Evolution
Despite slower growth compared to recent decades, global demand for primary chemicals would still rise 30% by 2050 from 2020 levels, ensuring continued growth opportunities for appropriate plastic solutions. However, the chemicals sector must undergo a profound emissions reduction—from 1.3 Gt in 2020 to just 65 Mt by 2050.
Recycling Revolution
A critical component of this transition is dramatically increased recycling rates. The NZE scenario projects global plastic recycling collection reaching 27% by 2030 and 54% by 2050, facilitating the shift from virgin-based to recycled and reused plastics while eliminating significant GHG emissions from chemical production.
Implications for Our Business
This scenario requires our business to substantially increase recycled resin usage. Any remaining virgin resin production would need to utilize:
- CCUS applications
- Hydrogen-based solutions
- Electrolysis processes
These technologies would effectively eliminate carbon emissions from production.
Strategic Direction
The IEA NZE Scenario serves as our roadmap for successfully navigating the transition to a zero-carbon, circular economy—revealing both the challenges we face and the opportunities that await.
Identifying and Classifying Risks and Opportunities
Berry Global performs multiple risk management processes annually in relation to climate change risk:
- The multi-disciplinary Berry Global Enterprise Risk Assessment (ERA)
- An annual carbon risk assessment in line with TCFD guidelines
- Double Materiality Assessment
Berry Global ERA
The Berry Global Enterprise Risk Assessment (ERA) operates on an annual cycle, employing multiple processes to identify risks across the organization. Approximately 35 senior management team members participate in interviews designed to uncover risks relevant to the business. These interviews span various geographies and functional areas including legal, division leadership, finance, human resources, purchasing, and sustainability, ensuring results reflect Berry's global operations.
The assessment extends beyond interviews through a questionnaire distributed to approximately 100 management employees representing diverse job functions and locations, capturing additional risk perspectives. All gathered information flows into a central database where risks are organized into approximately fifteen thematic categories such as supply chain (upstream), production (direct operations), infrastructure, and external market forces (downstream). Climate change is intrinsically connected to several of these themes, particularly resin purchases in the supply chain and energy usage and product design in production.
Each identified risk undergoes evaluation based on three dimensions: potential impact (ranging from insignificant to catastrophic), likelihood of occurrence (from unlikely to almost certain), and speed of onset (from immediate to long-term). These ratings generate a risk score—higher ratings for impact, likelihood, or speed of onset produce correspondingly higher risk scores.
The assessment culminates in a focused report detailing the top five risk themes extracted from the database. This report articulates both the inherent risks and key mitigation activities for each theme. The Audit Committee and Board receive this report, enabling them to implement appropriate mitigation plans addressing the most significant risks revealed through the process.
Annual Carbon Risk Assessment
In addition to and contributory to the ERA, Berry Global conducts annual carbon risk and physical risk assessments following Task Force on Climate Related Financial Disclosures (TCFD) guidelines. These assessments evaluate risks on a country-by-country basis, encompassing the UK and other global locations.
The carbon risk assessment leverages Berry Global's GHG inventory to estimate current energy costs based on the latest regulatory information and calculate associated transitional risks. These transitional carbon risks are then projected across various scenarios using different carbon prices, geographies, and time horizons.
For physical risks, the assessment analyzes locational data and historic climatic events to identify potential vulnerabilities. Mirroring the ERA methodology, each identified risk receives ratings for impact, likelihood of occurrence, and speed of onset. Assessment results flow directly to the CFO and CEO.
Beyond these annual evaluations, Berry Global monitors transitional risks continuously through automated, real-time dashboards that track energy use and GHG emissions at both site and divisional levels. This ongoing surveillance enables the identification of localized risks when usage data exceeds operational norms, with escalation pathways through the climate governance team when necessary. This real-time monitoring system provides more frequent risk and opportunity responses than the annual Enterprise Risk Assessment alone could deliver.
Double Materiality Assessment
We recently completed a Double Materiality Assessment (DMA) for the first time to comprehensively identify, assess, and manage our environmental dependencies, impacts, risks, and opportunities. The DMA approach allows us to view sustainability from two critical perspectives: financial materiality and impact materiality. From the financial perspective, we are able to assess how environmental factors, such as climate change, water availability, plastics, and biodiversity loss, directly influence our operations and financial performance. Simultaneously, from an impact materiality standpoint, we analyze how our operations affect the environment, understanding our impact from factors such as emissions, water usage, and plastic waste generation. By recognizing both how the environment influences us and how we influence it, we are able to better identify and assess our material impacts and dependencies, and furthermore those areas where our business might face risks or uncover opportunities for innovation and improvement.
Identified Risks and Opportunities
Climate risk can be categorized into several different risk types that are included within our climate risk assessments and considered relevant to our business. Forward looking climate risks are grouped into time horizons which are defined as follows:
| Short-term | 0-3 years |
| Medium-term | 3-6 years |
| Long-term | 6+ years |
Berry’s environmental (Climate-related) time horizons (Short 0-3, Medium 3-6, Long >6) are intentionally longer than our financial planning periods (Short 0-1, Medium 2-3, Long >3) due to the complex and long-term nature of environmental challenges. Strategic environmental planning must account for significant but slow-moving changes, such as those presented by climate change and resource depletion. Longer time horizons are critical to managing risks associated with evolving regulations, longer payback periods for investments in sustainable technologies, and the acute and chronic physical risks associated with a changing climate. Longer environmental time horizons allow us to take a proactive approach to climate risk, ensuring that our business remains viable and responsible over the long term, while still aligning with our overall financial objectives.
Once identified, the required risk management plan is dependent on the potential risk impact level and risk type, and the targeted risk source. Regulatory transitional risks generally require a chance to our direct operations, such investments in renewable energy and carbon offsets, and the implementation of energy efficiency projects, while transitional market risks management plans emphasize changes to our product portfolio. Management plans for acute physical risk mitigation focus on minimizing the personal cost-impact on our business in addition to generalized prevention through stakeholder interaction.
Climate risk types are set out below with a brief description of each.
Current Regulation
As we operate in the manufacturing sector, with energy making up a significant portion of operational spend, current climate change regulations can significantly affect the company.
Emerging Regulation
Current and future carbon prices as called for by regulation can significantly affect the company, with projections for large increases expected in carbon prices globally.
Technology
Technology is a key climate related risk considered by Berry’s risk assessment process. Technology is an important lever for reducing both energy intensity in Berry Global’s operations as well as the emissions intensity of the energy we purchase. Risks related to energy cost management are identified during site risk assessments and the development of energy efficiency programs is actioned to mitigate risks in this area.
Legal
The Berry risk assessment process is all encompassing, and we stay up to date on climate-related issues, including lawsuits.
Market
Market shifts and forecasts around fossil fuels are closely monitored since fossil fuels represent not just our primary energy sources, but also the primary source for most of our raw materials.
Reputation
Berry Global has identified increased risk associated with general perception of the products, including adverse publicity regarding plastic waste on the environment. The company already produces a considerable number of recyclable products and through innovation will continue to collaborate with customers to meet any change in demands and to reduce the carbon footprint and therefore the climate impact of products supplied.
Acute Physical
Berry Global businesses face the potential risk of operations being affected by disruption due to loss of supply, failures with technology, industrial disputes and physical damage arising from extreme weather events, such as flooding. The occurrence of these events might be significantly influenced by climate change. The loss of essential services or supplies could have a significant impact on Berry’s ability to service its customers.
Chronic Physical
Chronic physical risks are considered in the analysis of external risks. External risks occur in the environment outside the company and these risks tend to be those where the company has little or no control over the cause including the physical environment, political, legal, economic, social, cultural, and demographic factors.

The results of the above noted risk assessment processes have highlighted the below as examples of the most prevalent climate risks and opportunities impacting our business.
Risks:
| Risk Type |
Current/emerging regulation |
| Risk Driver Summary |
Carbon Pricing Mechanisms |
| Value chain location | Direct Operations |
| Primary Impact | Increased Operating Costs |
| Time Horizon | Medium-term |
| Likelihood | Likely |
| Magnitude | High |
| Risk Description | Berry Global uses over 4.6 million MWh of energy annually and has a Scope 1 & 2 CO2e footprint of almost 1.73 million MT. With the increased use of carbon pricing, this has the potential to increase our direct cost of energy. This increase in price is expected to be far higher than the typical price of inflation, and therefore it is considered to have a substantive fiscal impact on every facility that currently uses non-renewable energy, and a medium magnitude on our business as a whole. |
| Expected Risk Impact | Anticipating of an average global Carbon Tax of $120 USD/MT CO2e in 2030, and factoring in that we have sites in many different regions; some sites that lie in areas that have already implemented a carbon pricing structure, while others operate in jurisdictions that do not currently have carbon pricing, we can estimate a potential total annual Carbon Tax risk of $208 million in 2030, compared to $23 million currently, which is an increased risk of $185 million. |
| Risk mitigation | In order to completely mitigate the potential impact of carbon taxes, we would need to offset our direct use of energy onsite; our Scope 1 emissions and purchase renewable energy to eliminate Scope 2 emissions. Based on our 2023 Fiscal year Scope 1 emissions of 144k MT CO2e, and a current cost to offset these emissions of 30 USD/MT CO2e, we estimate the annual cost of offsetting these emissions to be 5 million USD. Based on our 2023 Fiscal Scope 2 electricity usage of 4.5 million MWh, and an average REC price of $2.3USD per MWh in NA, $0.95 USD per MWh in China and $3USD per MWh in ROW, we estimate the annual cost of purchasing 100% renewable electricity to be 11 million USD. This gives the total response as 15 million USA. This should be considered a conservative, worst-case scenario estimate; in-practice, more cost-effective methods would be used to reduce energy usage. |
| Risk Type | Emerging regulation |
| Risk Driver Summary |
Carbon Pricing Mechanisms |
| Value chain location |
Upstream Value Chain |
| Primary Impact | Increased raw material costs |
| Time Horizon | Medium-term |
| Likelihood | Likely |
| Magnitude | High |
| Risk Description | Increased use of carbon pricing has the potential to increase energy costs for Berry’s raw material suppliers, when this cost is passed down the supply chain it therefore becomes a risk for Berry Global related to increased raw material costs. Where raw material suppliers are exposed to increased/new carbon prices, we expect to have raw material cost increases above typical inflation; a substantive fiscal impact for impacted facilities, and a medium magnitude on our business as a whole. |
| Expected Risk Impact | Berry Global has committed to net-zero by 2050, with an SBti approved, short-term target of a 25% reduction in Scope 3 emissions by 2025 from a 2019 baseline. In-line to achieving net-zero, we would be working towards a 50% reduction by 2030 from a 2019 baseline. Although we expect to be on-track to hit these goals as part of our net zero strategy, under a worst-case scenario we can assume no further reduction in GHG Emissions relating to purchased resin from our 2022 total of 4.28 million MT CO2e. If all carbon tax increases are passed on to us, with an anticipation of an average Carbon Tax of $120 USD/MT CO2e in 2030 under NZE Scenario. This results in an increased Medium risk in 2030 of $514 million USD annually, based on the assumptions listed above. |
| Risk mitigation | Historically, we have been able to successfully manage the impact of higher raw material costs by increasing our selling prices. Sales contracts have cost pass-through clauses wherever possible. Additionally, we meet with our critical resin suppliers on a quarterly basis to drive them to reduce their emissions, through energy efficiency and the procurement of renewable energy to replace conventional energy sources. This would therefore reduce the impact of carbon pricing on their business, and associated cost impacts passed on to us. Over the last 10 years we have seen emissions factors associated with resin production falling substantially; US produced PP has fallen 18% over a 10-year period for example. If this trend continues, it will mitigate a large portion of the Potential Impact Figure. |
| Risk Type | Market |
| Risk Driver Summary |
Changing Consumer Behavior |
| Value chain location |
Direct Operations |
| Primary Impact | Decreased Revenues |
| Time Horizon | Long-term |
| Likelihood | Unlikely |
| Magnitude | Medium-high |
| Risk Description | As the world shifts to a low-carbon economy and consumers become more aware and educated about climate change, it has the potential to negatively impact consumers' view of fossil fuels and cause them to move away from the purchase of products that utilize fossil fuels in their manufacture. The primary raw material of Berry is polymer resin derived from fossil fuels therefore posing a risk to the products that Berry manufactures. |
| Expected Risk Impact | As identified by studies such as by the UK and European Plastics Pacts, consumer perception of packaging's sustainability will be a key driver over the next 10 years. In some cases, other material substrates may be considered by consumers as more sustainable, and therefore there is potential to have a decrease in revenue. The CPI & CPNA divisions of Berry manufacture fast moving consumer goods packaging where numerous other substrates are available from competitors that could be perceived as more environmentally conscious materials, despite the fact that plastic packaging often has a lower carbon footprint than alternative materials. Therefore, we have estimated the risk of a potential loss of 1% of total sales of fast-moving consumer goods (FMCGs). A 1% loss in sales from these would be in the order of magnitude of $71.5 million USD. |
| Risk mitigation | As part of our materiality assessment, we ask our key customers about their long-term vision for their products and partner with them to realize that vision. We would therefore not be blindsided by a large-scale shift. We also regularly monitor market trends, based on both external research, internal consumer research, and ultimately sales data - we would be one of the first to know if the market was shifting away from plastics. Additionally, we work with customers to educate them on the benefits of plastics and our products. We also work in our communities as well as with trade associations to educate end-consumers on the benefits of plastics. |
| Risk Type | Acute Physical |
| Risk Driver Summary |
Loss of production capacity |
| Value chain location |
Direct Operations |
| Primary Impact | Decreased Revenues |
| Time Horizon | Short-term |
| Likelihood | About as likely as not |
| Magnitude | Medium-Low |
| Risk Description | Berry Global operates in some geographic regions that are at acute physical climate risk from extreme weather events such as flooding e.g., mainland European manufacturing facilities, drought e.g., African manufacturing facilities, or storm/hurricane impacts e.g., South East USA. In many cases where this risk is apparent, some continuity of supply can be maintained by transferring business to alternative Berry sites, reducing the risk. |
| Expected Risk Impact | Any loss of business due to extreme weather events would adversely affect profit, depending on the size of the event and the number of sites that are affected. Excluding deductibles, the impact of Hurricane Laura in 2020 lead to total insurance claims over $10 million USD for business interruption & property damage, CBI, and incremental costs - relating to a resin shortage. The impact of Winter Storm Uri in 2021 on our business sat in the region of between $10 million USD and $20 million USD. Based on the data above, we can estimate that the potential upper limit impact on our business as a result of each extreme weather event lies around $20 million USD. There have been a number of smaller-impact extreme weather events over the last 10 years where costs have been in the region of $2-5million USD, so $2million USD will be used as a lower limit. |
| Risk mitigation | The primary method to manage this risk is through insurance. Potential insurance deductibles for each extreme weather invent lie in the region of $1 million USD for business interruption, property insurance and other incremental costs. This is the minimum cost to any response to mitigate the impact of an extreme event that has a substantial effect on our business. Additionally, we pay annual premiums for this insurance which are not included in our Cost of Response figure. |
| Risk Type | Emerging Regulation |
| Risk Driver Summary |
Regulation of existing products and services |
| Value chain location |
Downstream |
| Primary Impact | Decreased Revenues |
| Time Horizon | Medium-Term |
| Likelihood | Likely |
| Magnitude | Low |
| Risk Description | The effects of climate change are leading to the potential introduction of new regulatory changes including mandates on plastic packaging. The current proposal of the Packaging and Packaging Waste Directive from the European Commission proposes a requirement to allow only packaging that is designed for recyclability by 2030. Companies are now looking for materials that can offer the same benefits as PVC film but demonstrate an improved environmental profile. |
| Expected Risk Impact | The current proposal of the Packaging and Packaging Waste Directive from the European Commission that is now under review proposes a requirement to allow only packaging that is designed for recyclability by 2030. As a result of these developments, food companies are now looking for alternative materials that can offer the same benefits as PVC film but demonstrate an improved environmental profile. If we are unable to adapt and design reformulated products that are considered recyclable, then there is significant risk of losing that business. Our PVC film business in Europe, which is considered unrecyclable under potential incoming mandates, is between 3 – 4 million dollars per annum. The business accounts for over 50% of one site’s total business, and could mean site closure if the business was lost. |
| Risk mitigation | The primary method to manage this risk is through development of a new, recyclable, alternative solution. This requires research and development spend and the purchase of new lines for production. For development of a replacement for this business, we estimate this will require one-off costs of $500,000 in R&D and around $3,000,000 in new equipment. Once in place, additional extra costs will be negligible. |
Opportunities:
| Opportunity Type | Products and Services |
| Opportunity Driver Summary |
Development of New Products |
| Value chain location |
Downstream Value Chain |
| Primary Impact | Increased Revenues |
| Time Horizon | Short-term |
| Likelihood | Likely |
| Magnitude | High |
| Opportunity Description | For most of Berry Global’s customers, Scope 3 GHG emissions represent the largest portion of their total GHG emissions. We anticipate that will drive demand for products with lower emissions intensity. Plastics are already very well positioned since they typically have lower GHG emissions per functional unit than alternatives. Furthermore, Berry has a long history of light-weighting our products - further reducing their carbon intensity, and we working to increase our use of recycled content, which has lower associated GHG emissions than virgin resin. |
| Expected Opportunity Impact | Factoring in the likelihood of this opportunity to be realized, we estimate that new business as a result of our ability to provide low-carbon products could lead to around a 1% increase in revenue. We do not expect all of our customers to change at once. We anticipate the transition may be relatively slow. A 1% increase in revenue would result in an opportunity in the region of $126,600,000 USD. |
| Opportunity Type | Energy Source |
| Opportunity Driver Summary |
Direct emissions reduction |
| Value chain location |
Direct Operations |
| Primary Impact | Returns on investment in low-emission technology |
| Time Horizon | Short-term |
| Likelihood | Virtually Certain |
| Magnitude | Low |
| Opportunity Description | To aid our commitment to reducing our greenhouse gas emissions, we have the opportunity to enter into Purchase Power Agreements (PPAs) or Virtual Purchase Power Agreements (VPPAs). These would allow us to increase our renewable energy consumption, whether it be via a physical connection, or ownership of RECs, to reach our environmental goals, whilst also having the potential to save capital when electricity rates fluctuate. |
| Expected Opportunity Impact | A VPPA exchanges the variable OMIP market price for electricity against a fixed price per MWh based on our purchase annually. Therefore, the exact gains that will be realized will depend upon the actual market prices experienced during this period. The VPPA contract opportunity we are currently realizing had an estimated value of around $1 million, which it has far exceeded - while future ventures might not be as profitable. Based on this, we have set a Potential Impact figure of $0-$5m USD. As we investigate other VPPA opportunities we anticipate similar expected returns within this range. |
| Opportunity Type | Energy Source |
| Opportunity Driver Summary |
Direct Emissions Reduction |
| Value chain location |
Direct Operations |
| Primary Impact | Reduced exposure to Carbon Pricing |
| Time Horizon | Long-term |
| Likelihood | Virtually Certain |
| Magnitude | High |
| Opportunity Description | Berry Global is committed to reducing our energy consumption and lowering our carbon footprint by procuring more low-carbon energy, as well as implementing energy reduction initiatives. For example, we have an internal program to reduce 100,000,000KWh of energy use annually, and are looking into avenues to increase our current share of renewable energy. Taking this action gives us the additional opportunity to have reduced exposure to the current carbon taxes that are in place, and any future risk from carbon tax increases. |
| Expected Opportunity Impact | We have committed to net-zero by 2050, with an SBti approved, short-term target reduction in place for 2025. In-line to achieving net zero, we would be working towards a 50% reduction by 2030 from a 2019 baseline. Although we expect to hit these goals, under a worst-case scenario we can assume no further reduction in GHG Emissions, To calculate the potential opportunity figure by eliminating emission versus this worst-case scenario we have calculated the total costs under an anticipation of an average Carbon Tax of $120 USD/MT CO2e in 2030 under NZE Scenario using current emissions. This results in an increased long-term risk in 2030 of $185 million USD annually. |
| Opportunity Type | Products and Services |
| Opportunity Driver Summary |
Development of New Products |
| Value chain location |
Downstream Value Chain |
| Primary Impact | Increased Revenues |
| Time Horizon | Medium-Term |
| Likelihood | Likely |
| Magnitude | Low |
| Opportunity Description | The effects of climate change are leading to the potential introduction of new regulatory changes including mandates on plastic packaging. The current proposal of the Packaging and Packaging Waste Directive from the European Commission proposes a requirement to allow only packaging that is designed for recyclability by 2030. Companies are now looking for alternative materials that can offer the same benefits as PVC film but demonstrate an improved environmental profile. We have the opportunity to develop new products that align with these mandates to replace current business and potentially capture new businesses if peers are unable to adapt. |
| Expected Opportunity Impact | Our current PVC film business in Europe, which is considered unrecyclable under potential incoming mandates, is between 3 – 4 million dollars per annum, so as a worst-case scenario we have the opportunity to retain this value. However, we have a larger opportunity to potentially capture new businesses if peers are unable to adapt. |
Metrics and Targets
Greenhouse Gas Emission Targets
We have established ambitious climate action targets, committing to reduce both Scope 1 & 2 emissions and Scope 3 emissions by 25% by 2025 from our 2019 baseline. These short-term greenhouse gas reduction targets have received official validation from the Science Based Targets initiative (SBTi) as consistent with limiting global warming to 1.5°C and advancing toward a net-zero future.
Looking ahead, we have announced our commitment to achieve net-zero emissions by 2050. This long-term goal involves reducing our total emissions by over 90% from our 2019 baseline, with any residual emissions addressed through appropriate offsetting mechanisms. All these targets apply group-wide, adhering to our established reporting boundaries.
Methodological Approach
Our GHG emissions reporting follows the operational control method in accordance with the GHG Reporting Protocol and the GHG Protocol's Corporate Value Chain (Scope 3) Reporting and Accounting Standard. Under this approach, we report 100% of emissions from operations where we maintain full operational control, encompassing all manufacturing sites.
To enhance reporting efficiency and data quality, our scope reports exclude energy consumed in offices and non-production facilities, as well as emissions from refrigerants and welding gases. We estimate these exclusions represent less than 5% of our potential total operational and value-chain emissions footprint.
In our calculations, we apply Global Warming Potential values from the Intergovernmental Panel on Climate Change (IPCC) Fifth Assessment Report (AR5). Importantly, when determining our market-based GHG emissions, we do not include carbon offsets, as these are not considered when measuring progress toward our reduction targets.
Non-GHG Reporting
For non-GHG emissions data reporting and targets, we maintain consistent operational control boundaries, collecting comprehensive group-wide data for each fiscal year. Energy-related data points and targets specifically exclude information from non-production facilities, maintaining focus on our primary operational impacts.
Other Emissions-related Targets
To achieve our GHG emissions targets, mitigate our climate risks and work towards achieving climate opportunities, we have targets relating to a number of key performance indicators (KPI’s). These KPIs all have an effect on either our operational or value chain emissions.
- 1% year-over-year reduction in annual energy intensity
- Increase renewable energy year-over-year
- 100% reusable, recyclable, or compostable packaging by 2025
- Lightweight products
- Increase use of circular plastics
- 10% recycled content across our packaging by 2025
Operational Greenhouse Gas Emissions
Efforts to manage and reduce our operational emissions primarily fall under three categories: electrification of combustion sources, reduction in energy demand, and the use of cleaner energy. We continue to work on projects in all three areas to realize our short-term and long-term operational GHG emissions goals. As of 2024, 25% of our North American facilities use electric forklifts.

Absolute Scope 1 and 2 market-based GHG emissions were 1.61 Million Metric Tonnes (Mmt) in 2024, 5.8% lower than 2023, and 28.3% lower than our 2019 baseline emissions of 2.25 Mmt. As such, we continue to further exceed our 25% reduction target as we enter our 2025 target year. This was driven by our energy management processes, increased procurement of renewable electricity, an overall reduction in grid emission factors, and a decrease in production. We are now in the process of setting a new short-term operational greenhouse gas target for 2030.
Value Chain Greenhouse Gas Emissions
Our net-zero commitment also applies to our value chain emissions. Furthermore, in 2022 we set a near-term science-based target to reduce Scope 3 emissions 25% by 2025 versus our 2019 baseline, in line with limiting global warming to 1.5°C.

The majority of our overall GHG emissions reside in our value chain, representing 85% of our total emissions. The majority (65%) of our Scope 3 emissions occur from purchased goods and services. To minimize our Scope 3 emissions, we encourage our suppliers to develop low-carbon raw materials. We then collaborate with our customers to commercialize products we have made from those low-carbon raw materials.

In 2024, we calculated our Scope 3 GHG emissions to be just over 8.60 Mmt. This is slightly lower than our 2023 emissions, and was 22% lower than our 2019 baseline of 10.91 Mmt. We are on track to achieve a 25% reduction by 2025.
Total emissions from across our operations and value chain fell to under 10.22 Mmt in 2024, 12% lower than in 2022, and 23% lower than in 2019. This represents continued progress towards our recent commitment of net-zero by 2050. We fully anticipate achieving our first milestone on that journey, a 25% reduction by 2025.
Upstream & Downstream Transportation and Distribution
To understand the readiness of our over-the-road logistics partners to enable our mutual transition to net-zero, we request relevant energy and emissions information from current and potential providers. This includes information on fleet efficiency, progress on exploring zero-emission alternative transport methods, and commitment timelines for a net-zero fleet.
Our current focus is working with providers that manage their fleets most efficiently. We anticipate in the future that to maintain progress toward our net-zero commitment, we will either need to preferentially choose providers that offer zero-emission/lower emission transportation solutions or implement such requirements for our existing transportation providers. In 2024, we had a small number of shipments transported via our carriers in vehicles using renewable natural gas for the first time. We will continue to work with our transportation partners to investigate low-carbon logistics solutions going forward.
Air Quality
Refrigerants and other Ozone Depleting Substances (ODS) are regulated as hazardous materials by the U.S. Environmental Protection Agency due to their ozone depleting ability and powerful greenhouse gas potential. Our sites comply with regulatory requirements by creating an inventory of units containing refrigerants above the regulated quantity, monitoring releases, and documenting associated leak rates. Other air emissions, such as NOx, SOx, and VOCs, are evaluated for applicability and relevance to the site operation and processes. If applicable to the site, they are tracked, documented, and reported via the site’s air operating permits and emissions inventory, where the applicability and limits are established and monitored.
Depending on each site’s local requirements for monitoring and tracking other air emissions, our facilities may be required to control the release of these emissions according to established permit limits. This helps to protect the environment and reduces our impact on the communities in which we operate. For the vast majority of our facilities, NOx, SOx, and VOCs are not a significant source and we are not required to report or mitigate these emissions.
Energy Management

We track our operational energy metrics for all manufacturing facilities for which we have operational control. This excludes energy from non-manufacturing facilities, such as offices and warehouses. A full list of exclusions is outlined in the Greenhouse Gas Emissions section. The majority of our energy use is derived from electricity, with over 99% of the electricity we use sourced from the electrical grid. We do not currently calculate or report annually the energy associated with value-chain emissions.
Absolute energy use in 2024 fell by 1.2% from 2023, to 5.50 million megawatt hours (MWh), mainly due to a similar decrease in overall production. Although absolute energy reduction is key to achieving our GHG emissions goals, we use energy intensity as our key performance indicator (KPI), MWhs per metric ton processed – with the goal of reducing energy intensity 1% per year. Unfortunately, despite the implementation of numerous energy efficiency projects and achieving our 100 Million kWh goal, our energy intensity remained flat, with less than a 0.1% change compared to 2023. While in-depth analysis is still ongoing, the lack of reduction can be mainly attributed to the energy inefficiencies of reduced production offsetting the improvements made through energy efficiency projects.
100 Million KWh Challenge

Renewable Energy
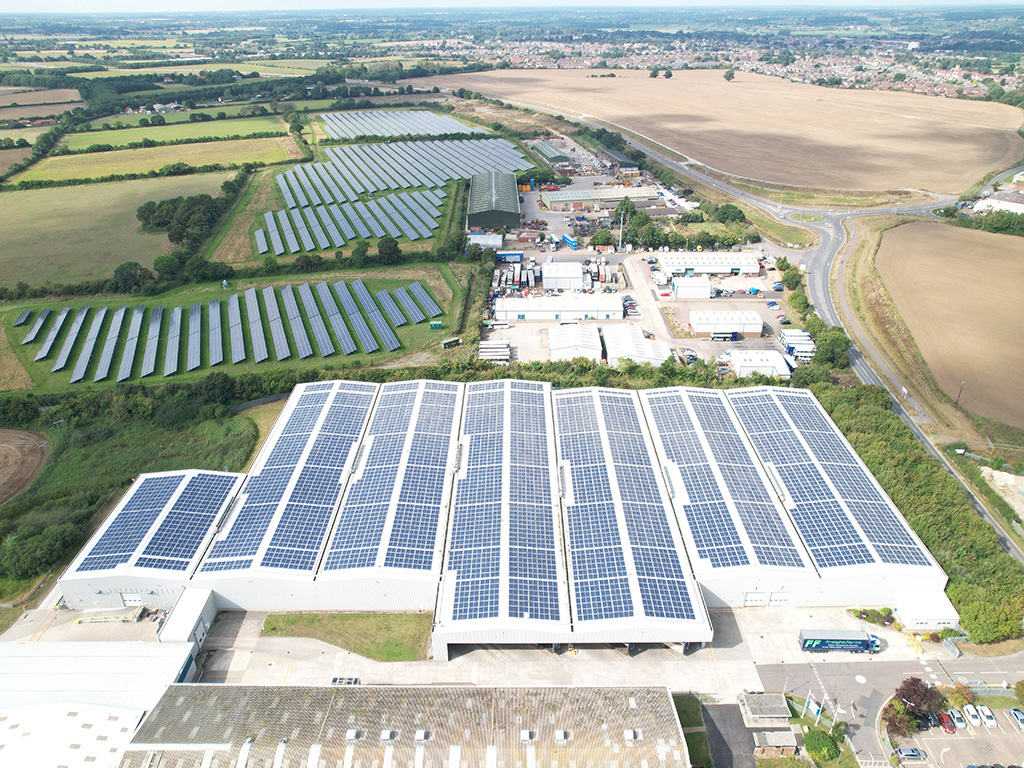
Because manufacturing is energy-intensive, effective energy management is one of our top priorities to minimize climate impact. We have a dual strategy to reduce our energy intensity and increase the use of renewable energy year over year.
In 2024 we used over 398,000 MWh of renewable electricity – 8.9% of our total electricity use and 7.2% of our total energy use. This represents both an increase in absolute usage and percent usage versus 2023, achieving our Impact 2025 target, with absolute renewable energy used increasing by 30%.

Disclosures
Contribution to the Sustainable Development Goals (SDGs)
An effective energy management program drives the growth of clean energy infrastructure, which in turn can accelerate the global transition to a sustainable energy system. We work to identify innovative clean energy solutions to reduce our emissions and promote a future with more sustainable energy.
To achieve sustainable economic growth of our business, in line with a net-zero and circular economy, we strive for continuous energy efficiency improvements, reducing operational costs and increasing the economic viability of our industry.
Through innovation in sustainable energy solutions and efficient industrial practices we drive the development of resilient infrastructure and promote sustainable industrialization as part of the transition towards a net-zero economy.
The adoption of sustainable energy practices reduces the amount of air pollution in urban environments. Through an increase in clean energy infrastructure, we are working to accelerate the transition to a sustainable, net-zero, energy system and improve the quality of our communities.
By working to improve our energy efficiency and reduce emissions, we help minimize our environmental impact and create responsible production and consumption patterns.
Our focus on energy efficiency and management directly addresses the call for climate action. By implementing strategies to minimize energy consumption and transition to renewable energy sources, we help reduce greenhouse gas emissions, combat climate change, and facilitate a net-zero world.

Achieving the global goal of net-zero emissions requires technological and industrial solutions from across the value chain, the implementation of positive government policies, and consumer behavioral changes. We collaborate with stakeholders to deliver a circular, net-zero future.
GRI and SASB Alignment
GRI 2-5 External Assurance
GRI 2-27 Compliance With Laws and Regulations
GRI 201-2 Financial Implications and Other Risks and Opportunities Due to Climate Change
GRI 302 (3-3) Energy
GRI 302-1 Energy Consumption Within the Organization
GRI 302-2 Energy Consumption Outside of the Organization
GRI 302-3 Energy Intensity
GRI 302-4 Reduction of Energy Consumption
GRI 302-5 Reductions in Energy Requirements of Products and Services
GRI 305 (3-3) Emissions
GRI 305-1 Direct (Scope 1) Green House Gas (GHG) Emissions
GRI 305-2 Energy Indirect (Scope 2) GHG Emissions
GRI 305-3 Other Indirect (Scope 3) GHG Emissions
GRI 305-4 GHG Emissions Intensity
GRI 305-5 Reduction of GHG Emissions
GRI 305-6 Emissions of Ozone-Depleting Substances (ODS)
GRI 305-7 Nitrogen Oxides (NOx), Sulfur Oxides (SOx), and Other Significant Air Emissions
SASB RT-CP-110a.1 Gross Total Scope 1 Emissions, Percentage Covered Under Emissions-Limiting Regulations
SASB RT-CP-110a.2 Discussion of Long-Term and Short-Term Strategy, or Plan to Manage Scope 1 Emissions, Emissions Reduction Targets, and an Analysis of Performance Against Those Targets
SASB RT-CP-120a.1 Air Emissions of the Following Pollutants: (1) NOx (excluding N2O) (2) SOx (3) Volatile Organic Compounds (VOCs) (4) Particulate Matter (PM)
SASB RT-CP-130a.1 (1) Total Energy Consumed (2) Percentage Grid Electricity (3) Percentage Renewable (4) Total Self-Generated Energy
Last updated: March 17, 2025