Significance
Importance To Berry Global and our Stakeholders
Our employees are our greatest asset, with their safety, well-being, and growth serving as the cornerstone of our business success. A safe, healthy work environment cultivates employee satisfaction and loyalty, directly enhancing productivity, product quality, and operational efficiency. Our engagement and development initiatives empower employees to contribute effectively while fostering innovation and continuous improvement. Engaged team members readily identify operational enhancements and provide valuable product development insights, driving our competitive edge.
Our comprehensive approach to employee development supports overall well-being, helping us attract premier talent and maintain a skilled workforce. This strategy elevates morale, reduces turnover, and creates the positive workplace culture essential for sustained business performance. By recruiting diverse, skilled individuals who share our values, we consistently meet our commitments, while our community partnerships demonstrate these values externally, strengthening stakeholder relationships.
Our Customers: Employee satisfaction directly influences customer experience. Our strong employee relations reflect our customers' values and address concerns about ethical practices. Our engaged workforce enhances productivity and service quality, creating superior customer experiences.
Our Investors: Employee relations significantly impact operational efficiency, risk management, and financial performance. By prioritizing workforce engagement, we improve productivity and reduce turnover, demonstrating operational resilience and strengthening investor confidence.
Our Approach
Berry is uncompromising in our pursuit of workplace safety, with an unwavering commitment to eliminating all potential incidents across every location. Our goal is to go beyond simple compliance to create an environment where every employee returns home safely. Our mission to “always advance to protect what’s important” doesn’t just apply to our products and processes—it also drives our approach to supporting our valuable team members. Our people are our greatest asset, and we are committed to cultivating a people-first culture that attracts, develops, and retains a high-performing workforce reflective of the communities in which we operate. We seek to provide a supportive environment that empowers employees, encourages professional growth, and creates meaningful connections. Through strategic philanthropic initiatives, charitable contributions, and employee volunteerism, we are committed to making a tangible, positive difference in the communities where we live and work—extending our impact far beyond our corporate boundaries.
Our Safety-First Culture
At Berry, safety is our top value. Our EHS Vision serves as a guide for everything we do, which covers incident prevention, risk management, culture, leading by example, our EHS management system, and compliance. Our “Stop Work” policy empowers our employees to halt all work immediately without fear of reprisal when a dangerous situation occurs. Our senior leadership meets weekly to discuss specific safety challenges and how to promote being proactive about minimizing safety incidents. As we continue to evolve our EHS approach, we are focusing on Severe Injury and Fatality (SIF) prevention and Life Saving Behaviors to anticipate and prevent behaviors that compromise safety.
Highlights and Target Progress
| Priority | 2024 Update |
| Injury free workplace; to reduce our total recordable incident rate to below 0.70 in 2023 |
We achieved a 6% reduction in our rate to 0.76 in 2024 |
| Expand training and development opportunities. |
We achieved an average of 54.3 hours of training per full time employee in 2024. |
| Increase engagement survey participation to 85% globally by 2025 | Engagement survey participation was 84% in 2024. 100% of locations provided engagement survey feedback and action planning. |
| Ensure 100% of locations provide engagement survey feedback and action planning | |
| 100% of locations provided engagement survey feedback and action planning. | 91% of all facilities completed an annual community volunteer program in 2024 |
| Grow global philanthropy with strategic charitable initiatives linked to UNSDGs |
Key Metrics
The below metrics are based on Berry's fiscal years unless otherwise noted.
|
Employee Engagement & Development |
|||||||
| 2022 | 2023 | 2024 | |||||
| Employee Engagement Survey¹ | Number of Employees and Participation Rate Percentage | ||||||
| Number | Percentage | Number | Percentage | Number | Percentage | ||
| Total Company | 35,447 | 75% | 39,092 | 86% | 41,758 | 84% | |
| Corporate | No Data | - | 3,130 | 93% | 752 | 93% | |
| Consumer Packaging International (CPI) Division | No Data | - | 15,678 | 84% | 17,609 | 87% | |
| Consumer Packaging North America (CPNA) Division | No Data | - | 7,790 | 72% | 9,817 | 79% | |
| Flexibles (FLEX) Division | No Data | - | 5,404 | 74% | 7,278 | 84% | |
| Health, Hygiene & Specialties (HHS) Division | No Data | - | 7,090 | 92% | 6,302 | 86% | |
| Engagement Score By Gender and Age | |||||||
| % of Responses | Score | % of Responses | Score | % of Responses | Score | ||
| All Employees | No Data | - | 100% | 54% | 100% | 55% | |
| Male | No Data | - | 62% | 54% | 59% | 56% | |
| Female | No Data | - | 27% | 62% | 26% | 63% | |
| Other/Gender Identity Not Listed | No Data | - | 1% | 35% | 1% | 31% | |
| Prefer Not to Answer | No Data | - | 10% | 33% | 14% | 37% | |
| Boomers (Born 1946-1964) | No Data | - | 10% | 57% | 7% | 58% | |
| Gen X (Born 1965-1980) | No Data | - | 35% | 56% | 34% | 57% | |
| Millennials (Born 1981-1999) | No Data | - | 39% | 55% | 40% | 57% | |
| Gen Z (Born 2000 - present) | No Data | - | 4% | 58% | 6% | 56% | |
| Prefer Not to Answer | No Data | - | 11% | 41% | 13% | 44% | |
| 2022 | 2023 | 2024 | |||||
| Total Training | Development Hours | ||||||
| Average Development Training hours per FTE | 54.2 | 57.5 | 54.31 |
||||
| 2024 | |||||||
| Skillsoft Training | Percentage of total eligible employees(%)1 | ||||||
| Employees that completed self-development training | 36% | ||||||
| Employees that completed compliance training | 98% | ||||||
| 2022 | 2023 | 2024 | |||||
| Employee Development | Self Development Course Data1 | ||||||
| Number of Participants | 9,211 | 5,472 | 8,154 |
||||
| Participation level (% of employees utalizing self development programs out of total with access to programs) |
No Data | 22% | 36% | ||||
| Module Completions | 142,391 | 90,774 | 39,566 | ||||
| Completion Hours | 30,431 | 20,036 | 23,851 | ||||
|
Talent Acquisition and Management |
|||||||
| 2022 | 2023 | 2024 | |||||
| Employee Hires | Employee Hires by Gender | ||||||
| Total | Total | Male | Female | Total | |||
| Total Company | 15,552 | 11,142 | 7,327 | 2,962 | 10,289 | ||
| North America | 11,217 | 8,305 | 5,217 | 2,104 | 7,321 | ||
| South America | 210 | 178 | 147 | 41 | 188 | ||
| EMEIA | 3,101 | 2,156 | 1,586 | 633 | 2,219 | ||
| Asia | 1,024 | 503 | 377 | 184 | 561 | ||
| Consumer Packaging International (CPI) Division | 6,367 | 2,607 | 1,809 | 870 | 2,679 | ||
| Consumer Packaging North America (CPNA) Division | 3,716 | 4,510 | 2,797 | 1,238 | 4,005 | ||
| Flexibles Division | 1,694 | 2,448 | 1,865 | 502 | 2,367 | ||
| Health, Hygiene & Specialties (HHS) Division | 3,650 | 1,499 |
815 |
315 |
1,130 |
||
| Corporate | 125 | 78 |
71 |
37 |
108 |
||
| Hires by Ethnicity (US Operations Only) | |||||||
| Total | Total | Total | |||||
| Total Hires | No Data | 7,808 | 4,979 | ||||
| White | No Data | 3,633 | 4,979 | ||||
| Black or African American | 888 | 2,324 | 1,478 | ||||
| Hispanic or Latino | 565 | 1,213 | 732 | ||||
| Indigenous or Native | 60 | 119 | 120 | ||||
| Asian | 80 | 181 | 148 | ||||
| Other Ethnic Minority | 125 | 338 | 159 | ||||
| Internal Hiring Rate(%)2 | |||||||
| Total | Total | Male | Female | Total | |||
| Total Company | No Data | No Data | 26% | 23% | 25% | ||
| North America | No Data | No Data | 27% | 25% | 27% | ||
| South America | No Data | No Data | 81% | 98% | 85% | ||
| EMEIA | No Data | No Data | 17% | 14% | 16% | ||
| Asia | No Data | No Data | 22% | 17% | 20% | ||
| Consumer Packaging Internal (CPI) Division | No Data | No Data | 8% | 40% | 18% | ||
| Consumer Packaging North America (CPNA) Division | No Data | No Data | 30% | 29% | 30% | ||
| Flexibles (FLEX) Division | No Data | No Data | 23% | 24% | 23% | ||
| Health, Hygiene & Specialties (HHS) Division | No Data | No Data | 28% | 18% | 25% | ||
| Corporate | No Data | No Data | 96% | 46% | 79% | ||
| Internal Hiring Rate (%)2 by Ethnicity (U.S. Operations Only) | |||||||
| Total | Total | Total | |||||
| Total Hires | No Data | No Data | 38% | ||||
| White | No Data | No Data | 49% | ||||
| Black or African American | No Data | No Data | 25% | ||||
| Hispanic or Latino | No Data | No Data | 37% | ||||
| Indigenous or Native | No Data | No Data | 28% | ||||
| Asia | No Data | No Data | 35% | ||||
| Other Ethnic Minority | No Data | No Data | 9% | ||||
| 2022 | 2023 | 2024 | |||||
| Employee Turnover | Employee Turnover Metrics by Gender | ||||||
| Total | Total | Male | Female | Total | |||
| Total Company | Total Departures | No Data | 13,633 | 7,998 | 3,438 | 11,436 | |
| Employee Turnover (%) | - | 30.30% | 19.20% | 8.20% | 27.40% | ||
| Voluntary Attrition Rate (%) | 22.00% | 17.20% | 10.00% | 4.60% | 14.60% | ||
| North America | Total Departures | No Data | 9,197 | 5,095 | 2,168 | 7,263 | |
| Employee Turnover (%) | - | 42.90% | 24.90% | 10.60% | 35.60% | ||
| Voluntary Attrition Rate (%) | 31.90% | 24.70% | 14.10% | 6.20% | 20.40% | ||
| South America | Total Departures | No Data | 241 | 143 | 46 | 189 | |
| Employee Turnover (%) | - | 21.40% | 13.30% | 4.30% | 17.50% | ||
| Voluntary Attrition Rate (%) | 6.10% | 6.20% | 4.00% | 1.40% | 5.40% | ||
| EMEIA | Total Departures | No Data | 3078 | 2,361 | 976 | 3,337 | |
| Employee Turnover (%) | - | 16.90% | 14.40% | 6.00% | 20.40% | ||
| Voluntary Attrition Rate (%) | 11.50% | 9.20% | 5.60% | 2.50% | 8.10%% | ||
| Asia | Total Departures | No Data | 1,117 | 399 | 248 | 647 | |
| Employee Turnover (%) | - | 27.10% | 10.50% | 6.50% | 16.90% | ||
| Voluntary Attrition Rate (%) | 21.90% | 16.50% | 8.40% | 4.80% | 13.20% | ||
| Consumer Packaging International (CPI) Division | Total Departures | No Data | 3,727 | 2,485 | 1,263 | 3,748 | |
| Employee Turnover (%) | - | 19.50% | 14.30% | 7.30% | 21.60% | ||
| Voluntary Attrition Rate (%) | 14.00% | 10.90% | 5.90% | 3.30% | 9.20% | ||
| Consumer Packaging North America (CPNA) Division | Total Departures | No Data | 5,088 | 2,589 | 1,312 | 3,901 | |
| Employee Turnover (%) | - | 48.20% | 25.80% | 13.10% | 38.90% | ||
| Voluntary Attrition Rate (%) | 34.40% | 26.20% | 13.40% | 7.00% | 20.30% | ||
| Flexibles Division | Total Departures | No Data | 2,935 | 1,857 | 495 | 2,352 | |
| Employee Turnover (%) | - | 42.10% | 25.70% | 6.80% | 32.50% | ||
| Voluntary Attrition Rate (%) | 36.70% | 28.30%% | 16.00% | 4.50% | 20.50% | ||
| Health, Hygiene & Specialties (HHS) Division | Total Departures | No Data | 1,765 | 993 | 324 | 1,317 | |
| Employee Turnover (%) | - | 23.50% | 15.80% | 5.20% | 21.00% | ||
| Voluntary Attrition Rate (%) | 13.20% | 11.60% | 7.40% | 3.10% | 10.60% | ||
| Corporate | Total Departures | No Data | 118 | 74 | 44 | 118 | |
| Employee Turnover (%) | - | 14.00% | 9.00% | 5.40% | 14.40% | ||
| Voluntary Attrition Rate (%) | 6.50% | 6.20% | 4.40% | 3.40% | 7.80% | ||
| Turnover by Ethnicity (US Operations Only) | |||||||
| Total | Total | Total | |||||
| All Employees | Total Departures | No Data | 8,615 | 11,436 | |||
| Employee Turnover (%) | - | - | 27.40% | ||||
| Voluntary Attrition Rate (%) | - | - | 14.60% | ||||
| White | Total Departures | No Data | 4,254 | 3,195 | |||
| Employee Turnover (%) | - | 22.10% | 7.70% | ||||
| Voluntary Attrition Rate (%) | - | 12.50% | 4.60% | ||||
| Black or African American | Total Departures | No Data | 2,343 | 1,892 | |||
| Employee Turnover (%) | - | 12.20% | 4.50% | ||||
| Voluntary Attrition Rate (%) | - | 6.60% | 2.50% | ||||
| Hispanic or Latino | Total Departures | No Data | 1,378 | 1,066 | |||
| Employee Turnover (%) | - | 7.20% | 2.60% | ||||
| Voluntary Attrition Rate (%) | - | 4.70% | 1.50% | ||||
| Indigenous or Native | Total Departures | No Data | 115 | 164 | |||
| Employee Turnover (%) | - | 0.60% | 0.40% | ||||
| Voluntary Attrition Rate (%) | - | 0.40% | 0.20% | ||||
| Asian | Total Departures | No Data | 185 | 189 | |||
| Employee Turnover (%) | - | 1.00% | 0.50% | ||||
| Voluntary Attrition Rate (%) | - | 0.70% | 0.30% | ||||
| Other Ethnic Minority | Total Departures | No Data | 340 | 4,930 | |||
| Employee Turnover (%) | - | 1.80% | 11.80% | ||||
| Voluntary Attrition Rate (%) | - | 1.00% | 5.60% | ||||
| 2022 | 2023 | 2024 | |||||
| Employee Retention | Percentage (%) of employees who remain employed over the fiscal year (By Gender) | ||||||
| Total | Total | Male | Female | Total | |||
| Total Company | No Data | 70.60% | 46.10% | 42.80% | 45.20% | ||
| North America | No Data | 58.10% | 62.10% | 60.50% | 61.70% | ||
| South America | No Data | 79.00% | 93.60% | 95.00% | 94.00% | ||
| EMEIA | No Data | 83.40% | 79.50% | 77.20% | 78.40% | ||
| Asia | No Data | 74.60% | 83.60% | 82.10% | 83.10% | ||
| Consumer Packaging International (CPI) Division | No Data | 81.10% | 78.80% | 82.10% | 78.40% | ||
| Consumer Packaging North America (CPNA) Division | No Data | 53.30% | 62.10% | 59.10% | 61.10% | ||
| Flexibles Division | No Data | 59.40% | 66.90% | 67.50% | 67.50% | ||
| Health, Hygiene & Specialties (HHS) Division | No Data | 85.40% | 80.00% | 75.00% | 79.00% | ||
| Corporate | No Data | 86.50% | 86.30% | 84.30% | 85.60% | ||
| Retention Rate by Ethnicity (US Operations Only) | |||||||
| Total | Total | Total | |||||
| Total US | No Data | No Data | 96% | ||||
| White | No Data | 78.50% | 73% | ||||
| Black or African American | No Data | 88.20% | 91% | ||||
| Hispanic or Latino | No Data | 93.00% | 94% | ||||
| Indigenous or Native | No Data | 99.40% | 99% | ||||
| Asian | No Data | 99.10% | 99% | ||||
| Other Ethnic Minority | No Data | 98.30% | 99% | ||||
| 2022 | 2023 | 2024 | |||||
| Employee Appraisals | Total | ||||||
| Percentage (%) of Salaried Employees Receiving Regular Performance Reviews3 | 99% | 99% | 99% | ||||
|
Employee Well-being, Health and Safety |
|||||||
| 2022 | 2023 | 2024 | |||||
| Third Party Health and Safety Certifications | Number and Percentage of Total Facilities | ||||||
| Number | Percentage | Number | Percentage | Number | Percentage | ||
| ISO 45001 | 24 | 9% | 29 | 11% | 20 | 9% | |
| 2024 | |||||||
| Function Specific Safety Training | Number of Employees | Course Completions | |||||
| Total Function Specific Safety Training | 10,296 | 97,388 | |||||
| Slips, Trips & Falls | 2,269 | 3,795 | |||||
| Lockout/Tagout Safety | 4,095 | 7,666 | |||||
| Machine Guarding | 2,694 | 5,325 | |||||
| Hand Safety | 2,710 | 4,145 | |||||
| Hot Work | 1,020 | 1,188 | |||||
| 2024 | |||||||
| Hazard and Risk Identification | Percentage | ||||||
| Facilities with Health and Safety Risk Assessment Completed | 100% | ||||||
| Number | |||||||
| Observations Completed | 282,501 | ||||||
| Good Catches | 143,487 | ||||||
| Near Misses and Hazards | 156,078 | ||||||
| 2024 | |||||||
| Health and Safety Committees | Percentage | ||||||
| Facilities with Health and Safety Committees in Place | 100% | ||||||
| 2020 | 2021 | 2022 | 2023 | 2024 | |||
| Safety Incident Recording | Whole Business | ||||||
| Total Labor Hours | No Data | No Data | No Data | No Data | > 91,000,000 | ||
| TRIR and LRFR by Region & Division | |||||||
| Total Recordable Incident Rate (TRIR) Total of work-related injury and Illness, multiplied by 200,000, divided by total labor hours |
Whole Business | 1.11 | 0.92 | 0.84 | 0.81 | 0.76 | |
| Whole Business - Temporary Employees4 | No Data | No Data | 0.38 | ||||
| Consumer Packaging International (CPI) Division | 0.5 | 0.41 | |||||
| Consumer Packaging North America (CPNA) Division | 1.15 | 0.92 | |||||
| Flexiable (FLEX) Division | 1.32 | 1.51 | |||||
| Health, Hygiene & Specialties (HHS) Division | 0.9 | 0.9 | |||||
| Corporate | 0 | 0.14 | |||||
| Lost-time Frequency Rate (LTFR) (per 1 million labor hours) Number of cases with lost time, multiplied by 1,000,000, divided by total labor hours |
Whole Business | 0.52 | 0.39 | 0.41 | 0.44 | 0.43 | |
| Whole Business - Temporary Employees4 | No Data | No Data | 0.24 | ||||
| Consumer Packaging International (CPI) Division | 0.44 | 0.37 | |||||
| Consumer Packaging North America (CPNA) Division | 0.33 | 0.19 | |||||
| Flexiable (FLEX) Division | 0.84 | 0.91 | |||||
| Health, Hygiene & Specialties (HHS) Division | 0.43 | 0.53 | |||||
| Corporate | 0 | 0 | |||||
| Rates and Totals for Other Key Safety Incident Metrics (Whole Business) | |||||||
| Serious Injuries or Fatalities (SIF) Rate (per 1 million labor hours) Total number of Serious Injuries or Fatalities, multiplied by 1,000,000, divided by labor hours. |
No Data | 0.17 | 0.2 | 0.15 | 0.1 | ||
| High-Consequences Work-Related Injuries Total number of work-related injury that results in a fatalitity or in an injury from which the worker cannot, does not, or is not expected to recover fully to pre-injury health status within 6 months |
No Data | No Data | No Data | 5 | 14 | ||
| High-Consequence Workl Related Injuries - Temporary Employees4 Total number of work-related injury that results in a fatality or in an injury from which the worker cannot, does not, or is not expected to recover fully to per-injury health status within 6 months |
No Data | No Data | No Data | No Data | 0 | ||
| Work-Related Fatalities A work-related incident resulting in death |
0 | 1 | 1 | 1 | 1 | ||
| Work-related Fatalities - Temporary Employees4 A work-related incident resulting in death |
No Data | No Data | No Data | 0 | 0 | ||
| Fatality Rate Number of work-related fatalities, divided by labor hours, multiplied by 200,000 |
0 | 0.002 | 0.002 | 0.002 | 0.002 | ||
| Fatality Rate - Temporay Employees4 Number of work-related fatalities, divided by labor hours, multiplied by 200,000 |
No Data | No Data | No Data | 0 | 0 | ||
| Number of Work-related Accidents | No Data | No Data | No Data | No Data | 347 | ||
| 2020 | 2021 | 2022 | 2023 | 2024 | |||
| Ill Health Incident Recording | Totals for Key Ill Health Incident Metrics | ||||||
| Incidents of Work-related Ill Health An Illness that is caused or contributed to by an event or exposure in the work environment |
12 | 1 | 0 | 2 | 2 | ||
| Number of Fatalities as a Result of Work-related Ill Health | 0 | 0 | 0 | 0 | 0 | ||
|
Community Partnerships |
|||||||
| 2022 | 2023 | 2024 | |||||
| Community Events | Percentage of Facilities Who Conducted at Least One Community Event | ||||||
| Facilities Participating | 75% | 90% | 91%5 |
||||
1 Training datapoints exclude the Health, Hygiene & Specialties (HHS) Division.
2 Internal Hiring Rate represents the percentage of each employee category that were hired internally.
3 We are transitioning to a new online performance management system in Fiscal Year 2025 in connection with the ongoing upgrade of our existing Human Capital Management system, so reported data is an estimate. Berry strongly believes in ensuring that employees are involved in regular performance management/coaching conversations with their direct supervisor.
4 Temporary Workers are contractors that work on our facilites with daily supervision from Berry, performing tasks similar to our entry-level workforce.
5 Excludes facilites in the Health, Hygiene & Specialties (HHS) Division.
Key Strategies
Sustainability begins with our people and communities. We create positive impact globally by strategically investing our time, resources, knowledge, and expertise where they matter most—in the communities surrounding our manufacturing and innovation centers.
With over 40,000 employees worldwide, we're committed to building a workplace where diverse identities, talents, skills, and experiences are not just welcomed but fully leveraged. This commitment extends beyond our organization to meet the evolving expectations of our global customers and key stakeholders.
Our Partners Strategy strengthens our people-first culture through three pillars: fostering diversity and inclusion, implementing talent strategies that attract and develop a skilled, diverse workforce, and driving meaningful philanthropic initiatives that transform our communities.
Employee Health, Safety and Well-Being
Our number one core value is safety, and our ultimate safety goal is to achieve zero incidents of any type across all locations. No job is so urgent, and no schedule so rigid, that work cannot be completed in a safe manner. Each employee is given the knowledge, skills, and understanding of their responsibility to take care of themselves and their teammates while at work. Worldwide, we recognize teammates looking after teammates. We are proud of this culture and see it as a key differentiator and an anchor for our Health and Safety program.
With safety as our number one value, we are driven by the nine key Environmental, Health, and Safety (EHS) Principles:
- Each of us is responsible for the safety and health of ourselves and others.
- Each of us is responsible for our impact on the environment.
- We only carry out tasks that we have been trained and authorized to do.
- We do not take shortcuts that compromise safety.
- We never operate unsafe equipment.
- We report and resolve hazards that could affect health, safety, and the environment.
- We challenge anyone not behaving safely.
- Wherever personal protective equipment is needed, we wear it at all times.
- We ensure visitors and contractors know and follow our rules.

Employee safety is managed through our EHS Management Framework and supported by our EHS policy. In addition, we have implemented an EHS vision and nine EHS principles to further mitigate the risk of on-site safety incidents.
We continue to work towards our ultimate goal of zero incidents. That said, when incidents do occur, we conduct a detailed data analysis to help prevent recurrence. We track eight key performance indicators relating to employee and contractor safety and publicly report five years’ worth of company-wide data.

After reducing our TRIR to 0.81 in 2023, we set an ambitious target of 0.70 for 2024. While we ultimately fell short of the target, we once again improved our year over year rate by 6% to 0.76. Additionally, 128 of our facilities achieved zero recordable incidents of any kind in 2023, reflecting the success of our EHS framework and the dedication and leadership of all our employees to help ensure the safety of themselves and others.
Environmental, Health, and Safety Policy
Our comprehensive EHS policy goes beyond industry standards, establishing elevated safety requirements throughout our operations. This approach enables swift, effective hazard mitigation across all facilities, creating consistently safe environments for everyone.
While leadership maintains ultimate accountability for EHS implementation, safety thrives through universal participation. Each employee actively contributes to both personal and collective wellbeing through a culture of shared responsibility. At our company, safety isn't merely a condition of employment—it's fundamental to our identity and operational philosophy.
EHS Management Framework
Our globally integrated EHS framework delivers protection through a robust Health and Safety Management System for all employees and contractors. Structured around 20 essential elements in three strategic categories—foundational EHS, hazard management, and specialized risk areas—this comprehensive approach guides every facility toward meeting and exceeding our rigorous safety standards.
We maintain excellence through systematic internal audits, targeted guidance, and continuous training. These regular assessments verify proper implementation while identifying opportunities for enhancement. Beyond our proprietary system, we actively pursue ISO 45001 certification, the international benchmark for occupational health and safety management. Our commitment has resulted in 20 facilities certified to ISO 45001.
Employee Training
Effective framework implementation requires both clear understanding of responsibilities and comprehensive knowledge of safety practices. We equip our workforce through a multi-layered educational approach that builds competency and reinforces our safety culture.
Every employee receives customized, role-specific training tailored to their position—including critical areas like fall protection, hazard avoidance, lockout/tagout procedures, and electrical safety. This foundation is strengthened through our digital platforms offering instruction on non-negotiable safety principles. We further reinforce these concepts through strategic in-person coaching and real-time safety observations.
We invest fully in this educational process, providing all training at zero cost to employees. New team members complete essential safety programs before beginning work and receive dedicated orientation to our specific EHS policies, vision, and operational procedures—ensuring alignment from day one.
In 2024, over 97,000 function-specific safety courses were completed across our business by almost 10,000 individual employees.
EHS Committees
Every facility maintains an active EHS Committee with cross-functional representation spanning all organizational levels. These committees serve as the cornerstone of our collaborative safety approach, empowering employees to directly shape program implementation and drive continuous improvement initiatives.
Operating under formal charters, these committees conduct regular meetings with documented attendance, clearly defined processes, and assigned responsibilities. This structured approach ensures consistent focus on identifying opportunities and implementing solutions that enhance workplace safety and employee wellbeing throughout our operations.
Hazard & Risk Identification
Risk Management and Hazard Prevention
Proactive risk identification and management form the cornerstone of injury prevention and successful EHS implementation. We've developed a comprehensive approach that engages every team member in creating safer workplaces through systematic processes and practical tools.
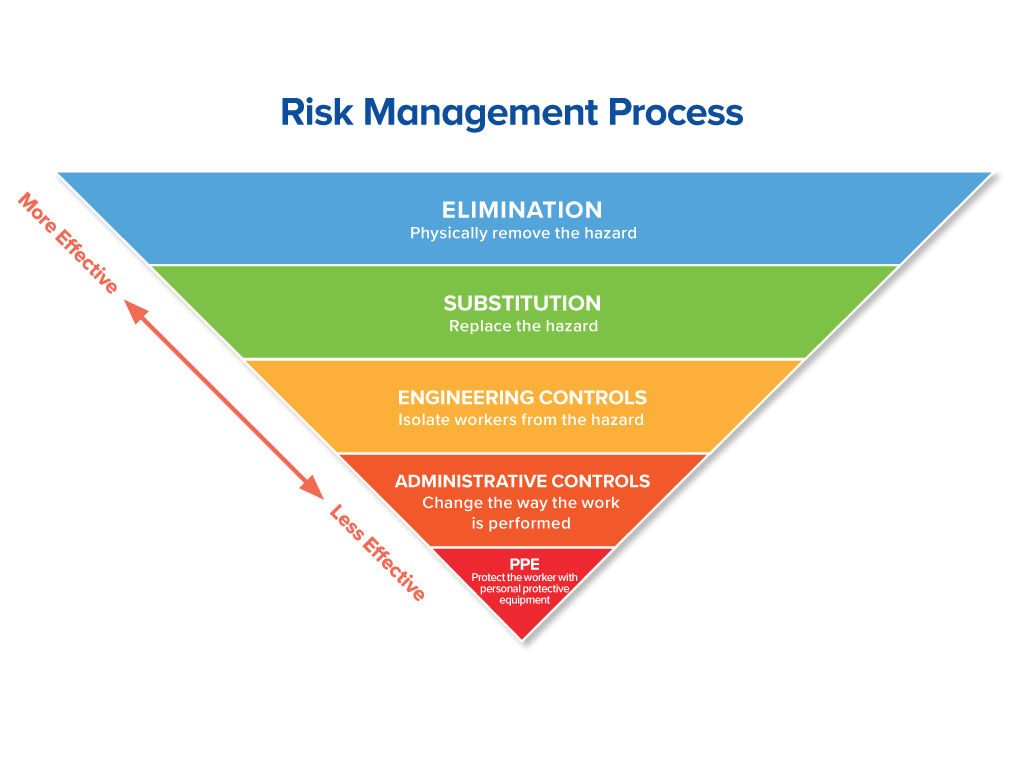
Our structured risk management model equips employees with practical knowledge spanning six critical phases: hazard identification, risk assessment, prioritization, control implementation, monitoring, and review. Through mandatory training, all team members master the hierarchy of control principles—ensuring consistent methodology when determining the most effective hazard mitigation strategies. We emphasize hazard elimination as the primary objective, while recognizing Personal Protective Equipment as an essential final defense layer.
We utilize regular team member observations to identify potential hazards before incidents occur. This collaborative process encourages environmental feedback and enables prompt corrective action against unsafe conditions. Our "good catch" program celebrates proactive risk identification, with impressive results—over 282,000 observations conducted and 143,000 potential risks addressed in 2024 alone. These metrics guide our strategic focus areas for hazard elimination, significantly reducing recordable incident risks.
Additionally, our comprehensive tracking of "near misses and hazards" across all facilities provides valuable insights into potential injury scenarios that were narrowly avoided. This data-driven approach enables us to implement targeted corrective measures, addressing emerging risk patterns before they result in actual incidents. In 2024, we identified over 156,000 “near misses and hazards”, and we are working to reduce the number of near miss events going forward to help ensure a safe working environment for our team members.
Contractor Safety
Our comprehensive contractor EHS program extends our rigorous safety standards to all external partners working within our operations. This structured program ensures contractors not only understand but actively uphold our environmental, health, and safety requirements throughout their engagement.
At our facilities, contractors bear multilevel responsibility—for their own safety, their employees' wellbeing, and the protection of our team members. Through clear communication of expectations, thorough procedural training, and detailed documentation requirements, we create an integrated safety ecosystem where all parties understand their specific roles and responsibilities within our safety framework.
Responsibilities:
Our EHS Team: Maintains a rigorously vetted registry of qualified contractors, conducts systematic safety performance audits, and ensures project managers fully understand their contractor oversight responsibilities.
Our Project Managers: Serve as the critical link between our safety standards and contractor implementation. They provide comprehensive safety documentation, verify questionnaire completion through EHS validation, communicate job-specific hazards and procedures, confirm training completion, ensure safety equipment accessibility, and monitor site policy compliance.
Contract Companies: Bear direct responsibility for securing all necessary site permits, verifying worker qualifications, ensuring proper medical evaluations are completed, and providing appropriate personal protective equipment to their personnel.
Procedures:
Operational Procedures
Contractor Requirements: All contractors must demonstrate thorough understanding of site-specific EHS policies, complete required safety training, and conduct all work in strict accordance with our comprehensive safety guidelines.
Qualification Process: We implement a rigorous pre-award evaluation system requiring all potential contractors to complete detailed safety questionnaires for thorough review. Our selection criteria prioritize safety excellence, with disqualification for substandard safety records. Approval factors include documented safety performance history, current EHS training certifications, and evidence of robust safety protocols.
Continuous Oversight: Project Managers and EHS specialists conduct systematic inspections throughout project execution. Our zero-tolerance approach to safety violations includes immediate personnel removal and potential contract termination for non-compliance with established safety protocols.
Training:
Incident Management: Contractors must report all injuries or accidents to Project Managers immediately, regardless of severity. They are also required to conduct thorough investigations of any on-site incidents to identify root causes and preventive measures.
Mandatory Orientation: Before commencing any work, contractors must provide documentation of completed annual EHS orientation training covering fundamental OSHA safety topics, our specific EHS policies and expectations, and proper reporting protocols for incidents, near misses, and hazards.
Specialized Qualifications: Contract companies bear responsibility for ensuring their employees receive appropriate task-specific training that meets or exceeds all applicable Federal and State regulations, including critical safety domains such as lockout/tagout procedures, fall protection systems, electrical safety protocols, and hot work requirements.
Health and Well-Being
Our industry presents specific occupational health challenges beyond general workplace hazards, particularly in hearing and respiratory domains. We implement a hierarchical approach—first seeking to eliminate these hazards entirely, and where elimination isn't feasible, deploying comprehensive protective measures through our structured PPE Policy.
This policy articulates our health protection commitment while providing employees with practical guidance for illness prevention. Key provisions include mandatory hearing protection in designated areas and facility-specific Respiratory Protection Programs (RPPs) designed to address location-based respiratory risks.
Following targeted health initiatives implemented after 2020 incidents, we've achieved remarkable improvement—recording only three work-related health incidents from 2021-2023, with zero fatalities throughout our operational history. These results validate our systematic approach to occupational health management.
Beyond occupational safety, we maintain a holistic commitment to employee wellbeing through our comprehensive support infrastructure. Our customized well-being program addresses physical, emotional, and financial health needs with country-specific resources while promoting healthy work-life integration. We take pride in offering flexible, personalized resources that accommodate the diverse needs of our global workforce.
Employee Engagement
We are committed to fostering a culture of highly engaged employees who are given the opportunity to pursue personal development and ultimately achieve their career goals. We accomplish this by providing a variety of development opportunities (both online and instructor-led training) and helping ensure all team members can have their voice heard through our annual employee engagement survey.
Employee Engagement Survey
In 2024, we conducted another global engagement survey to better understand both our strengths and opportunities for improvement across Berry—at the company, division, location, and team levels. The survey garnered responses from 84% of our global workforce (41,758 team members), with every location (100%) providing feedback and action planning.
Questions covered individual engagement, flexibility, meaningful recognition, and understanding of how one's work contributes to company success. The survey also explored leadership behaviors, personal development opportunities, and inclusion. Our average engagement score reached 55%. For complete results, please refer to page 55 of the sustainability report.
Employee Communication Outreach
A robust and effective internal communication program is essential to allow meaningful engagement with and among our team members across the globe. We have introduced numerous key communicators and multiple communication vehicles–spanning electronic, print, and face-to-face - that provide colleagues with information such as business initiatives, company performance, benefit offerings and development opportunities. Through these platforms we can also celebrate individual successes and provide a focal point for OneBerry to support each other, our communities, and our world.
Employee Development
On-Demand Learning
Berry’s myDevelopment learning management system provides access to more than 1,500 self-development and skill-development courses in multiple languages. Because we continue to see significant utilization of this development tool, more courses are being added in the near term. Of our workforce who had access to the program, 36% utilized at least one course in 2024; 8,154 participants completed 39,566 individual courses.
Employee Training
Understanding Berry’s global organization and business strategy is important for every role within our company. Through a variety of training programs, we provide our team members across the globe with Berry-specific skills and capabilities and custom development courses in sustainability, project management, and Lean Six Sigma to help progress their personal and professional goals. In 2024, we achieved an average of 54.3 training hours per team member, resulting in over 2 million training hours completed. These training hours included instructor-led sessions, various online learning platforms, and new-hire onboarding.
Talent Management and Acquisition
The continued growth and evolution of our team are integral to our success and ability to deliver against business objectives. Our talent management process creates a level platform to assess the behaviors and capabilities of our team by providing a common language to describe “what good looks like” in Berry leadership. Our ultimate goal is to support and advance the careers of the critical team members who will champion the growth of our business and lead the organization into the future.
Annual Performance Process
Our talent management strategy centers on structured annual performance reviews designed to drive employee development and organizational success. By establishing clear goals and assessment frameworks, we create accountability while helping team members prioritize key metrics and strategic initiatives that advance both our organization and their careers.
Following each engagement survey, site leadership conducts focused analysis to develop targeted action plans addressing specific improvement opportunities. This site-customized approach enables continuous enhancement of employee engagement by responding directly to feedback-identified needs.
Our collaborative goal-setting process engages employees and managers in establishing three to five strategic role-specific objectives, complemented by one to two personal development goals that support career advancement. For leadership team members, targets cascade directly from organizational priorities to ensure alignment with our broader business strategy.
The process begins with managers contextualizing company, division, or location objectives before collaboratively developing individual SMART goals—ensuring all performance targets are Specific, Measurable, Achievable, Relevant, and Time-Bound.
Global Leadership Development Program
In 2024, Berry launched two sessions of our Leadership Development Program in North America and Europe. The three-day program featured certified internal facilitators from across the region who led core leadership modules based on our Learning Agility methodology. Participants gained valuable exposure to senior leadership while engaging in team-building activities and networking opportunities. Participants present a continuous improvement project about their learnings to senior leadership.
Community Partnerships
With the goal of growing our business in a way that is responsible for our people, society, and the environment, we proudly support nonprofit organizations that help create or support community resilience and growth.
Beyond the products we make, we value strong, sustainable partnerships within our communities around the globe. Partnering with our communities is of top importance to our employees and, in turn, our teams have partnered with their local communities to make a positive impact. In 2024, employees participated in community events ranging from environmental clean-ups, holiday toy collections, and donations of thousands of dollars to those in need.
In 2021, we announced our goal to make certain that 100% of our facilities coordinate annual employee volunteer events. In response, 75% of facilities hosted a community event at their facility in 2022, 90% in 2023, and 91% in 2024. Some examples of volunteer events include:
- Tree planting activities (Shenzen, China)
- Raising money and materials for victims of flash floods (Valencia, Spain)
- Earth Day community cleanup day (Fulton Kentucky)
- Organizing holiday toy drives (Rhymney, UK)
- Supporting animal shelters (Muscatine, Iowa)
Berry’s Global Center of Excellence and Circular Innovation Hub
In 2024, Berry opened the International Center of Excellence and Circular Innovation Hub in Barcelona, Spain to advance circular solutions with international customers and partners, create new job opportunities for the local community, and create a space for collaboration and innovation. Barcelona, Spain was chosen as the location for the Center of Excellence and Hub due to its scoring in international talents, sustainability, and diversity. Within the first year, Berry doubled the number of employees working at the center while achieving gender parity and a representation of over16 different nationalities.
Helping Refugees Restart Their Lives
In recognition of the growing refugee crisis around the world, Berry’s Refugee Hiring Program—in partnership with local agencies such as Catholic Charities and Della Lamb—helps refugees find employment at Berry in a way which offers financial independence, long-term career growth, and a culture that celebrates each individual so they can feel welcomed, valued, and respected at work. All of this is accomplished while helping overcome barriers along the way to self-sufficiency. Since 2023, nearly 300 refugees have been placed in a growing Berry Global refugee integration program across the United States—with many coming from East Africa, Afghanistan, and Ukraine.
Berry International Graduate Development Program
Berry’s International Graduate Development Program cultivates future leaders through a two-year accelerated experience across our sites around the globe, including Europe, the U.S., and China. This program combines hands-on leadership training with practical experience through rotational placements across different facilities, functions, and business units. Participants develop essential leadership capabilities—from impactful presentation skills to change management—while gaining valuable cross-divisional and international exposure that prepares them for leadership roles within the company
Employee Benefits
Wellness and mental health continued to be a focus globally for our Benefits and Human Resources teams throughout 2024. Recognizing this, Berry placed a high priority on the holistic care of employees and their families. We continue to provide our Employee Assistance Program (EAP) to more than 40,000 employees. Our EAP provides access to professionals that can assist team members facing challenges that could impact work or home life, such as stress and anxiety, family concerns, or legal issues.
Example U.S. Benefits
Regular, full-time employees or part-time employees working at least 30 hours per week enjoy a variety of benefit offerings, including:
- 401(k) retirement plan
- Medical plans, including prescription drug coverage
- Variable performance-based component to pay
- Dental plans
- Vision plans
- Life insurance
- Global Employee Assistance Program (EAP)
- Communications, including email, in-app communication cards, communications toolkit, digital monitors, and monthly newsletter
- Well-being program
- Fertility benefits
- Prudential Financial Wellness program
Disclosures
Contribution to the Sustainable Development Goals (SDGs)
The provision of fair wages, benefits, and opportunities for skill development contribute to lifting employees out of poverty and increasing prosperity. As a global employer of over 40,000 people, we are committed to ensuring all our employees are fairly compensated for their work.
By prioritizing the health, safety, and well-being of our employees and visitors, we establish a safe work environment, reducing risks, accidents, and illness.
Our employee training and development programs provide opportunities for skill enhancement, training, and personal and professional growth, contributing to a skilled and educated workforce. We continuously aim to train, develop, and educate our employees at all levels to progress their careers.

We champion advancements in gender equality in the workplace through robust talent acquisition and management practices that promote diversity and inclusivity and provide equal access to development opportunities.
We operate robust programs to improve employee well-being, emphasizing decent working conditions, fair wages, & growth opportunities. These practices contribute to creating a motivated workforce & align with the goal of promoting sustained, inclusive, & sustainable economic growth & decent work for all.
By providing equal opportunities for employment, development, and well-being to all current and potential employees, we contribute to eliminating inequality.
As part of our social responsibility commitments, we provide a robust employee relations program that includes working in partnership with local communities to provide societal benefits and enhance social cohesion.
We are committed to promoting a positive work environment and respecting workers' rights in alignment with the goal of fostering peaceful and just societies. We provide employee training on global anti-corruption and provide mechanisms for all employees to report ethics violations.

Actively engaging with employees, local communities, and other external stakeholders helps us build resilient, inclusive communities. Furthermore, investing in employee training, development and talent management helps lead to further knowledge sharing that is vital for fostering effective partnerships.
GRI and SASB Alignment
GRI 401(3-3) EmploymentGRI 401-1 New Employee Hires and Employee Turnover
GRI 401-2 Benefits Provided to Full-Time Employees That are Not Provided to Temporary Employees
GRI 403 (3-3) Occupational Health and Safety
GRI 403-1 Occupational Health and Safety Management System
GRI 403-2 Hazard Identification, Risk Assessment, and Incident Investigation
GRI 403-3 Occupational Health Services
GRI 403-4 Worker Participation, Consultation, and Communication on Occupational Health and Safety
GRI 403-5 Worker Training on Occupational Health and Safety
GRI 403-6 Promotion of Worker Health
GRI 403-7 Prevention and Mitigation of Occupational Health and Safety Impacts Directly Linked by Business Relationships
GRI 403-8 Workers Covered by an Occupational Health and Safety Management System
GRI 403-9 Work-Related Injuries
GRI 403-10 Work-Related Ill Health
GRI 404 (3-3) Training and Education
GRI 404-1 Average Hours of Training Per Employee
GRI 404-2 Programs for Upgrading Employee Skills and Transition Assistance Programs
GRI 404-3 Percentage of Employees Receiving Regular Performance and Career Development Reviews
Last updated: December 14th 2023